White/Caucasian vs Delaware Per Capita Income
COMPARE
White/Caucasian
Delaware
Per Capita Income
Per Capita Income Comparison
Whites/Caucasians
Delaware
$42,180
PER CAPITA INCOME
15.9/ 100
METRIC RATING
205th/ 347
METRIC RANK
$40,778
PER CAPITA INCOME
3.8/ 100
METRIC RATING
233rd/ 347
METRIC RANK
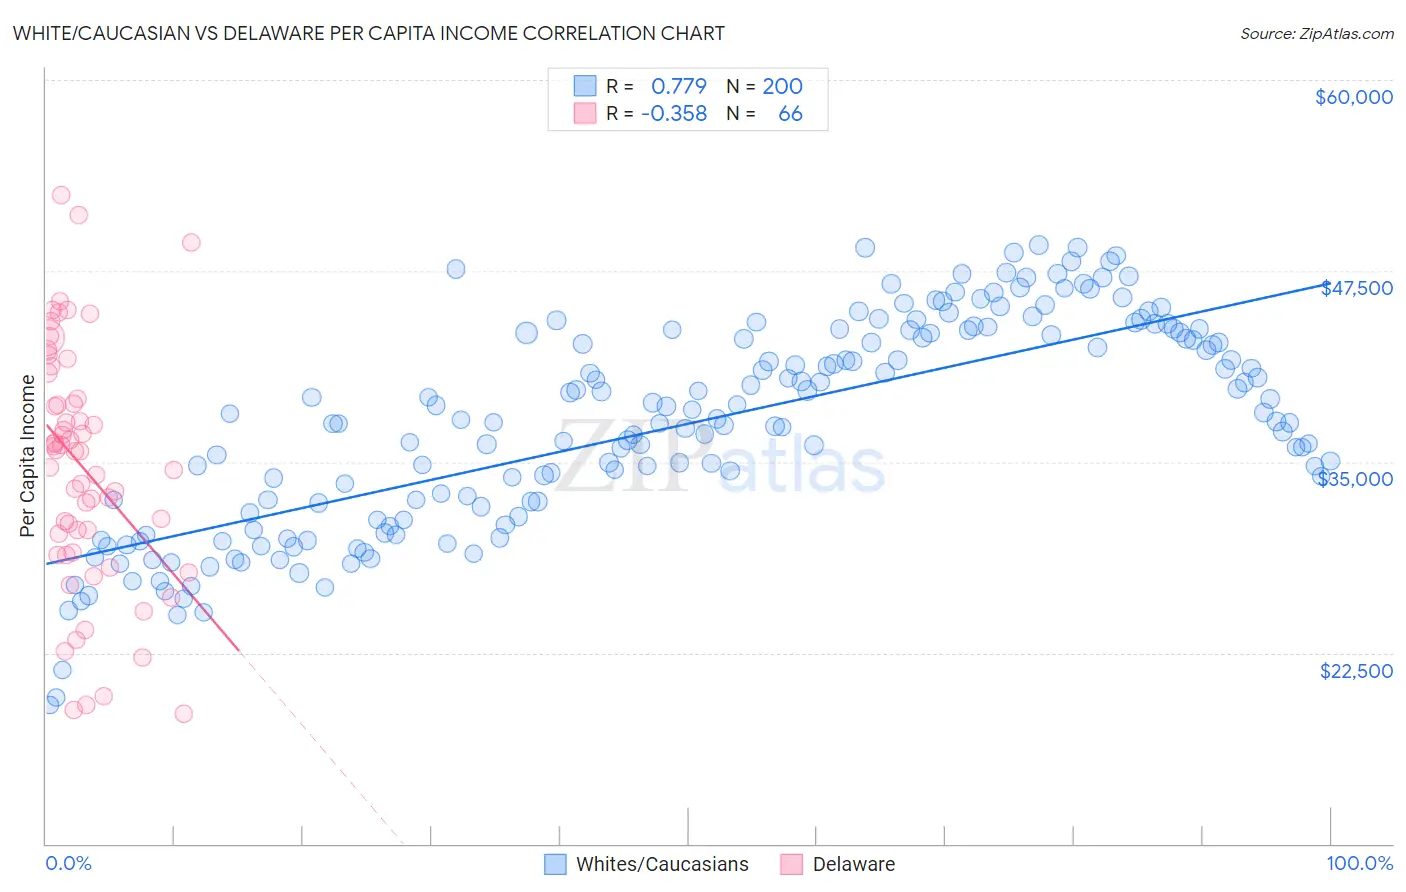
White/Caucasian vs Delaware Per Capita Income Correlation Chart
The statistical analysis conducted on geographies consisting of 585,276,990 people shows a strong positive correlation between the proportion of Whites/Caucasians and per capita income in the United States with a correlation coefficient (R) of 0.779 and weighted average of $42,180. Similarly, the statistical analysis conducted on geographies consisting of 96,239,490 people shows a mild negative correlation between the proportion of Delaware and per capita income in the United States with a correlation coefficient (R) of -0.358 and weighted average of $40,778, a difference of 3.4%.
Per Capita Income Correlation Summary
| Measurement | White/Caucasian | Delaware |
| Minimum | $19,081 | $18,507 |
| Maximum | $49,196 | $52,470 |
| Range | $30,115 | $33,963 |
| Mean | $37,504 | $34,628 |
| Median | $37,771 | $35,673 |
| Interquartile 25% (IQ1) | $31,862 | $29,044 |
| Interquartile 75% (IQ3) | $43,459 | $39,167 |
| Interquartile Range (IQR) | $11,597 | $10,124 |
| Standard Deviation (Sample) | $6,823 | $7,889 |
| Standard Deviation (Population) | $6,806 | $7,829 |
Similar Demographics by Per Capita Income
Demographics Similar to Whites/Caucasians by Per Capita Income
In terms of per capita income, the demographic groups most similar to Whites/Caucasians are Ghanaian ($42,164, a difference of 0.040%), Aleut ($42,210, a difference of 0.070%), Spanish ($42,249, a difference of 0.16%), Immigrants from Bosnia and Herzegovina ($42,278, a difference of 0.23%), and Venezuelan ($42,074, a difference of 0.25%).
| Demographics | Rating | Rank | Per Capita Income |
| Immigrants | Portugal | 19.7 /100 | #198 | Poor $42,412 |
| Barbadians | 19.6 /100 | #199 | Poor $42,406 |
| Vietnamese | 19.0 /100 | #200 | Poor $42,368 |
| Immigrants | Thailand | 17.6 /100 | #201 | Poor $42,289 |
| Immigrants | Bosnia and Herzegovina | 17.5 /100 | #202 | Poor $42,278 |
| Spanish | 17.0 /100 | #203 | Poor $42,249 |
| Aleuts | 16.4 /100 | #204 | Poor $42,210 |
| Whites/Caucasians | 15.9 /100 | #205 | Poor $42,180 |
| Ghanaians | 15.7 /100 | #206 | Poor $42,164 |
| Venezuelans | 14.4 /100 | #207 | Poor $42,074 |
| Panamanians | 13.9 /100 | #208 | Poor $42,035 |
| Immigrants | Sudan | 13.2 /100 | #209 | Poor $41,986 |
| Ecuadorians | 12.9 /100 | #210 | Poor $41,958 |
| Immigrants | Panama | 11.6 /100 | #211 | Poor $41,853 |
| Immigrants | Senegal | 11.3 /100 | #212 | Poor $41,830 |
Demographics Similar to Delaware by Per Capita Income
In terms of per capita income, the demographic groups most similar to Delaware are Immigrants from West Indies ($40,763, a difference of 0.040%), Immigrants from Guyana ($40,742, a difference of 0.090%), Nonimmigrants ($40,669, a difference of 0.27%), Guyanese ($40,949, a difference of 0.42%), and Senegalese ($41,000, a difference of 0.55%).
| Demographics | Rating | Rank | Per Capita Income |
| Immigrants | Ecuador | 5.9 /100 | #226 | Tragic $41,195 |
| Immigrants | Ghana | 5.5 /100 | #227 | Tragic $41,131 |
| Immigrants | Grenada | 5.5 /100 | #228 | Tragic $41,123 |
| Nigerians | 4.9 /100 | #229 | Tragic $41,026 |
| Native Hawaiians | 4.9 /100 | #230 | Tragic $41,017 |
| Senegalese | 4.8 /100 | #231 | Tragic $41,000 |
| Guyanese | 4.5 /100 | #232 | Tragic $40,949 |
| Delaware | 3.8 /100 | #233 | Tragic $40,778 |
| Immigrants | West Indies | 3.7 /100 | #234 | Tragic $40,763 |
| Immigrants | Guyana | 3.6 /100 | #235 | Tragic $40,742 |
| Immigrants | Nonimmigrants | 3.4 /100 | #236 | Tragic $40,669 |
| Immigrants | Cambodia | 2.6 /100 | #237 | Tragic $40,434 |
| Somalis | 2.4 /100 | #238 | Tragic $40,367 |
| Tsimshian | 2.4 /100 | #239 | Tragic $40,344 |
| Immigrants | Nigeria | 2.3 /100 | #240 | Tragic $40,339 |