White/Caucasian vs Scottish Per Capita Income
COMPARE
White/Caucasian
Scottish
Per Capita Income
Per Capita Income Comparison
Whites/Caucasians
Scottish
$42,180
PER CAPITA INCOME
15.9/ 100
METRIC RATING
205th/ 347
METRIC RANK
$44,440
PER CAPITA INCOME
70.6/ 100
METRIC RATING
153rd/ 347
METRIC RANK
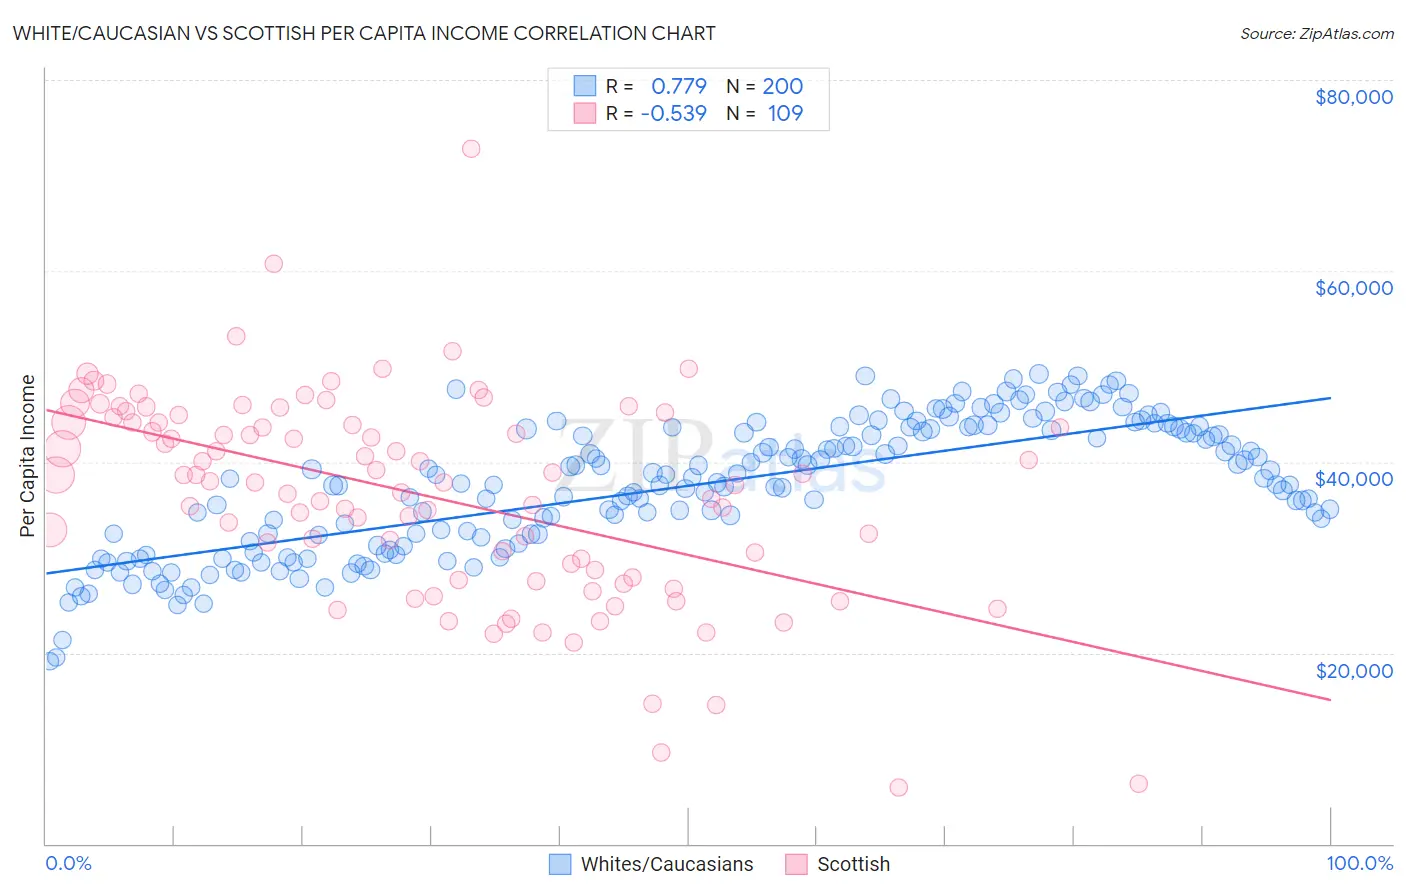
White/Caucasian vs Scottish Per Capita Income Correlation Chart
The statistical analysis conducted on geographies consisting of 585,276,990 people shows a strong positive correlation between the proportion of Whites/Caucasians and per capita income in the United States with a correlation coefficient (R) of 0.779 and weighted average of $42,180. Similarly, the statistical analysis conducted on geographies consisting of 567,196,152 people shows a substantial negative correlation between the proportion of Scottish and per capita income in the United States with a correlation coefficient (R) of -0.539 and weighted average of $44,440, a difference of 5.4%.
Per Capita Income Correlation Summary
| Measurement | White/Caucasian | Scottish |
| Minimum | $19,081 | $5,913 |
| Maximum | $49,196 | $72,790 |
| Range | $30,115 | $66,877 |
| Mean | $37,504 | $36,544 |
| Median | $37,771 | $37,961 |
| Interquartile 25% (IQ1) | $31,862 | $28,258 |
| Interquartile 75% (IQ3) | $43,459 | $44,399 |
| Interquartile Range (IQR) | $11,597 | $16,142 |
| Standard Deviation (Sample) | $6,823 | $10,868 |
| Standard Deviation (Population) | $6,806 | $10,818 |
Similar Demographics by Per Capita Income
Demographics Similar to Whites/Caucasians by Per Capita Income
In terms of per capita income, the demographic groups most similar to Whites/Caucasians are Ghanaian ($42,164, a difference of 0.040%), Aleut ($42,210, a difference of 0.070%), Spanish ($42,249, a difference of 0.16%), Immigrants from Bosnia and Herzegovina ($42,278, a difference of 0.23%), and Venezuelan ($42,074, a difference of 0.25%).
| Demographics | Rating | Rank | Per Capita Income |
| Immigrants | Portugal | 19.7 /100 | #198 | Poor $42,412 |
| Barbadians | 19.6 /100 | #199 | Poor $42,406 |
| Vietnamese | 19.0 /100 | #200 | Poor $42,368 |
| Immigrants | Thailand | 17.6 /100 | #201 | Poor $42,289 |
| Immigrants | Bosnia and Herzegovina | 17.5 /100 | #202 | Poor $42,278 |
| Spanish | 17.0 /100 | #203 | Poor $42,249 |
| Aleuts | 16.4 /100 | #204 | Poor $42,210 |
| Whites/Caucasians | 15.9 /100 | #205 | Poor $42,180 |
| Ghanaians | 15.7 /100 | #206 | Poor $42,164 |
| Venezuelans | 14.4 /100 | #207 | Poor $42,074 |
| Panamanians | 13.9 /100 | #208 | Poor $42,035 |
| Immigrants | Sudan | 13.2 /100 | #209 | Poor $41,986 |
| Ecuadorians | 12.9 /100 | #210 | Poor $41,958 |
| Immigrants | Panama | 11.6 /100 | #211 | Poor $41,853 |
| Immigrants | Senegal | 11.3 /100 | #212 | Poor $41,830 |
Demographics Similar to Scottish by Per Capita Income
In terms of per capita income, the demographic groups most similar to Scottish are Norwegian ($44,480, a difference of 0.090%), Peruvian ($44,479, a difference of 0.090%), Immigrants from Eritrea ($44,509, a difference of 0.16%), Portuguese ($44,362, a difference of 0.18%), and Korean ($44,522, a difference of 0.19%).
| Demographics | Rating | Rank | Per Capita Income |
| Irish | 75.8 /100 | #146 | Good $44,679 |
| Czechs | 74.1 /100 | #147 | Good $44,595 |
| Immigrants | Armenia | 73.1 /100 | #148 | Good $44,552 |
| Koreans | 72.5 /100 | #149 | Good $44,522 |
| Immigrants | Eritrea | 72.1 /100 | #150 | Good $44,509 |
| Norwegians | 71.5 /100 | #151 | Good $44,480 |
| Peruvians | 71.5 /100 | #152 | Good $44,479 |
| Scottish | 70.6 /100 | #153 | Good $44,440 |
| Portuguese | 68.7 /100 | #154 | Good $44,362 |
| Uruguayans | 67.6 /100 | #155 | Good $44,318 |
| Slovaks | 65.4 /100 | #156 | Good $44,229 |
| South American Indians | 64.8 /100 | #157 | Good $44,206 |
| Immigrants | Nepal | 64.3 /100 | #158 | Good $44,187 |
| South Americans | 62.4 /100 | #159 | Good $44,114 |
| Danes | 61.9 /100 | #160 | Good $44,095 |