White/Caucasian vs Indian (Asian) Per Capita Income

COMPARE

White/Caucasian
Race
Ancestry
AfghanAfricanAlaska NativeAlaskan AthabascanAlbanianAleutAlsatianAmericanApacheArabArapahoArgentineanArmenianAssyrian/Chaldean/SyriacAustralianAustrianBahamianBangladeshiBarbadianBasqueBelgianBelizeanBermudanBhutaneseBlackfeetBolivianBrazilianBritishBritish West IndianBulgarianBurmeseCajunCambodianCanadianCape VerdeanCarpatho RusynCelticCentral AmericanCentral American IndianCherokeeCheyenneChickasawChileanChineseChippewaChoctawColombianColvilleComancheCosta RicanCreeCreekCroatianCrowCubanCypriotCzechCzechoslovakianDanishDelawareDominicanDutchDutch West IndianEastern EuropeanEcuadorianEgyptianEnglishEstonianEthiopianEuropeanFijianFilipinoFinnishFrenchFrench American IndianFrench CanadianGermanGerman RussianGhanaianGreekGuamanian/ChamorroGuatemalanGuyaneseHaitianHmongHonduranHopiHoumaHungarianIcelanderIndonesianInupiatIranianIraqiIrishIroquoisIsraeliItalianJamaicanJapaneseJordanianKenyanKiowaKoreanLaotianLatvianLebaneseLiberianLithuanianLumbeeLuxembourgerMacedonianMalaysianMalteseMarshalleseMenomineeMexicanMexican American IndianMongolianMoroccanNative HawaiianNavajoNepaleseNew ZealanderNicaraguanNigerianNorthern EuropeanNorwegianOkinawanOsageOttawaPaiutePakistaniPalestinianPanamanianParaguayanPennsylvania GermanPeruvianPimaPolishPortuguesePotawatomiPuebloPuerto RicanPuget Sound SalishRomanianRussianSalvadoranSamoanScandinavianScotch-IrishScottishSeminoleSenegaleseSerbianShoshoneSierra LeoneanSiouxSlavicSlovakSloveneSomaliSouth AfricanSouth AmericanSouth American IndianSoviet UnionSpaniardSpanishSpanish AmericanSpanish American IndianSri LankanSubsaharan AfricanSudaneseSwedishSwissSyrianTaiwaneseThaiTlingit-HaidaTohono O'OdhamTonganTrinidadian and TobagonianTsimshianTurkishU.S. Virgin IslanderUgandanUkrainianUruguayanUteVenezuelanVietnameseWelshWest IndianYakamaYaquiYugoslavianYumanYup'ikZimbabwean
Immigration
NonimmigrantsImmigrantsAfghanistanAfricaAlbaniaArgentinaArmeniaAsiaAustraliaAustriaBahamasBangladeshBarbadosBelarusBelgiumBelizeBoliviaBosnia and HerzegovinaBrazilBulgariaBurma/MyanmarCabo VerdeCambodiaCameroonCanadaCaribbeanCentral AmericaChileChinaColombiaCongoCosta RicaCroatiaCubaCzechoslovakiaDenmarkDominicaDominican RepublicEastern AfricaEastern AsiaEastern EuropeEcuadorEgyptEl SalvadorEnglandEritreaEthiopiaEuropeFijiFranceGermanyGhanaGreeceGrenadaGuatemalaGuyanaHaitiHondurasHong KongHungaryIndiaIndonesiaIranIraqIrelandIsraelItalyJamaicaJapanJordanKazakhstanKenyaKoreaKuwaitLaosLatin AmericaLatviaLebanonLiberiaLithuaniaMalaysiaMexicoMicronesiaMiddle AfricaMoldovaMoroccoNepalNetherlandsNicaraguaNigeriaNorth AmericaNorth MacedoniaNorthern AfricaNorthern EuropeNorwayOceaniaPakistanPanamaPeruPhilippinesPolandPortugalRomaniaRussiaSaudi ArabiaScotlandSenegalSerbiaSierra LeoneSingaporeSomaliaSouth AfricaSouth AmericaSouth Central AsiaSouth Eastern AsiaSouthern EuropeSpainSri LankaSt. Vincent and the GrenadinesSudanSwedenSwitzerlandSyriaTaiwanThailandTrinidad and TobagoTurkeyUgandaUkraineUruguayUzbekistanVenezuelaVietnamWest IndiesWestern AfricaWestern AsiaWestern EuropeYemenZaireZimbabweAzores
Indian (Asian)
Race
Ancestry
AfghanAfricanAlaska NativeAlaskan AthabascanAlbanianAleutAlsatianAmericanApacheArabArapahoArgentineanArmenianAssyrian/Chaldean/SyriacAustralianAustrianBahamianBangladeshiBarbadianBasqueBelgianBelizeanBermudanBhutaneseBlackfeetBolivianBrazilianBritishBritish West IndianBulgarianBurmeseCajunCambodianCanadianCape VerdeanCarpatho RusynCelticCentral AmericanCentral American IndianCherokeeCheyenneChickasawChileanChineseChippewaChoctawColombianColvilleComancheCosta RicanCreeCreekCroatianCrowCubanCypriotCzechCzechoslovakianDanishDelawareDominicanDutchDutch West IndianEastern EuropeanEcuadorianEgyptianEnglishEstonianEthiopianEuropeanFijianFilipinoFinnishFrenchFrench American IndianFrench CanadianGermanGerman RussianGhanaianGreekGuamanian/ChamorroGuatemalanGuyaneseHaitianHmongHonduranHopiHoumaHungarianIcelanderIndian (Asian)IndonesianInupiatIranianIraqiIrishIroquoisIsraeliItalianJamaicanJapaneseJordanianKenyanKiowaKoreanLaotianLatvianLebaneseLiberianLithuanianLumbeeLuxembourgerMacedonianMalaysianMalteseMarshalleseMenomineeMexicanMexican American IndianMongolianMoroccanNative HawaiianNavajoNepaleseNew ZealanderNicaraguanNigerianNorthern EuropeanNorwegianOkinawanOsageOttawaPaiutePakistaniPalestinianPanamanianParaguayanPennsylvania GermanPeruvianPimaPolishPortuguesePotawatomiPuebloPuerto RicanPuget Sound SalishRomanianRussianSalvadoranSamoanScandinavianScotch-IrishScottishSeminoleSenegaleseSerbianShoshoneSierra LeoneanSiouxSlavicSlovakSloveneSomaliSouth AfricanSouth AmericanSouth American IndianSoviet UnionSpaniardSpanishSpanish AmericanSpanish American IndianSri LankanSubsaharan AfricanSudaneseSwedishSwissSyrianTaiwaneseThaiTlingit-HaidaTohono O'OdhamTonganTrinidadian and TobagonianTsimshianTurkishU.S. Virgin IslanderUgandanUkrainianUruguayanUteVenezuelanVietnameseWelshWest IndianYakamaYaquiYugoslavianYumanYup'ikZimbabwean
Immigration
NonimmigrantsImmigrantsAfghanistanAfricaAlbaniaArgentinaArmeniaAsiaAustraliaAustriaBahamasBangladeshBarbadosBelarusBelgiumBelizeBoliviaBosnia and HerzegovinaBrazilBulgariaBurma/MyanmarCabo VerdeCambodiaCameroonCanadaCaribbeanCentral AmericaChileChinaColombiaCongoCosta RicaCroatiaCubaCzechoslovakiaDenmarkDominicaDominican RepublicEastern AfricaEastern AsiaEastern EuropeEcuadorEgyptEl SalvadorEnglandEritreaEthiopiaEuropeFijiFranceGermanyGhanaGreeceGrenadaGuatemalaGuyanaHaitiHondurasHong KongHungaryIndiaIndonesiaIranIraqIrelandIsraelItalyJamaicaJapanJordanKazakhstanKenyaKoreaKuwaitLaosLatin AmericaLatviaLebanonLiberiaLithuaniaMalaysiaMexicoMicronesiaMiddle AfricaMoldovaMoroccoNepalNetherlandsNicaraguaNigeriaNorth AmericaNorth MacedoniaNorthern AfricaNorthern EuropeNorwayOceaniaPakistanPanamaPeruPhilippinesPolandPortugalRomaniaRussiaSaudi ArabiaScotlandSenegalSerbiaSierra LeoneSingaporeSomaliaSouth AfricaSouth AmericaSouth Central AsiaSouth Eastern AsiaSouthern EuropeSpainSri LankaSt. Vincent and the GrenadinesSudanSwedenSwitzerlandSyriaTaiwanThailandTrinidad and TobagoTurkeyUgandaUkraineUruguayUzbekistanVenezuelaVietnamWest IndiesWestern AfricaWestern AsiaWestern EuropeYemenZaireZimbabweAzores
Per Capita Income
Income
Poverty
Unemployment
Labor Participation
Family Structure
Vehicle Availability
Education Level
Disability

Per Capita Income Comparison

Whites/Caucasians

Indians (Asian)

Poor
Exceptional
$42,180
PER CAPITA INCOME
15.9/ 100
METRIC RATING
205th/ 347
METRIC RANK
$53,874
PER CAPITA INCOME
100.0/ 100
METRIC RATING
22nd/ 347
METRIC RANK

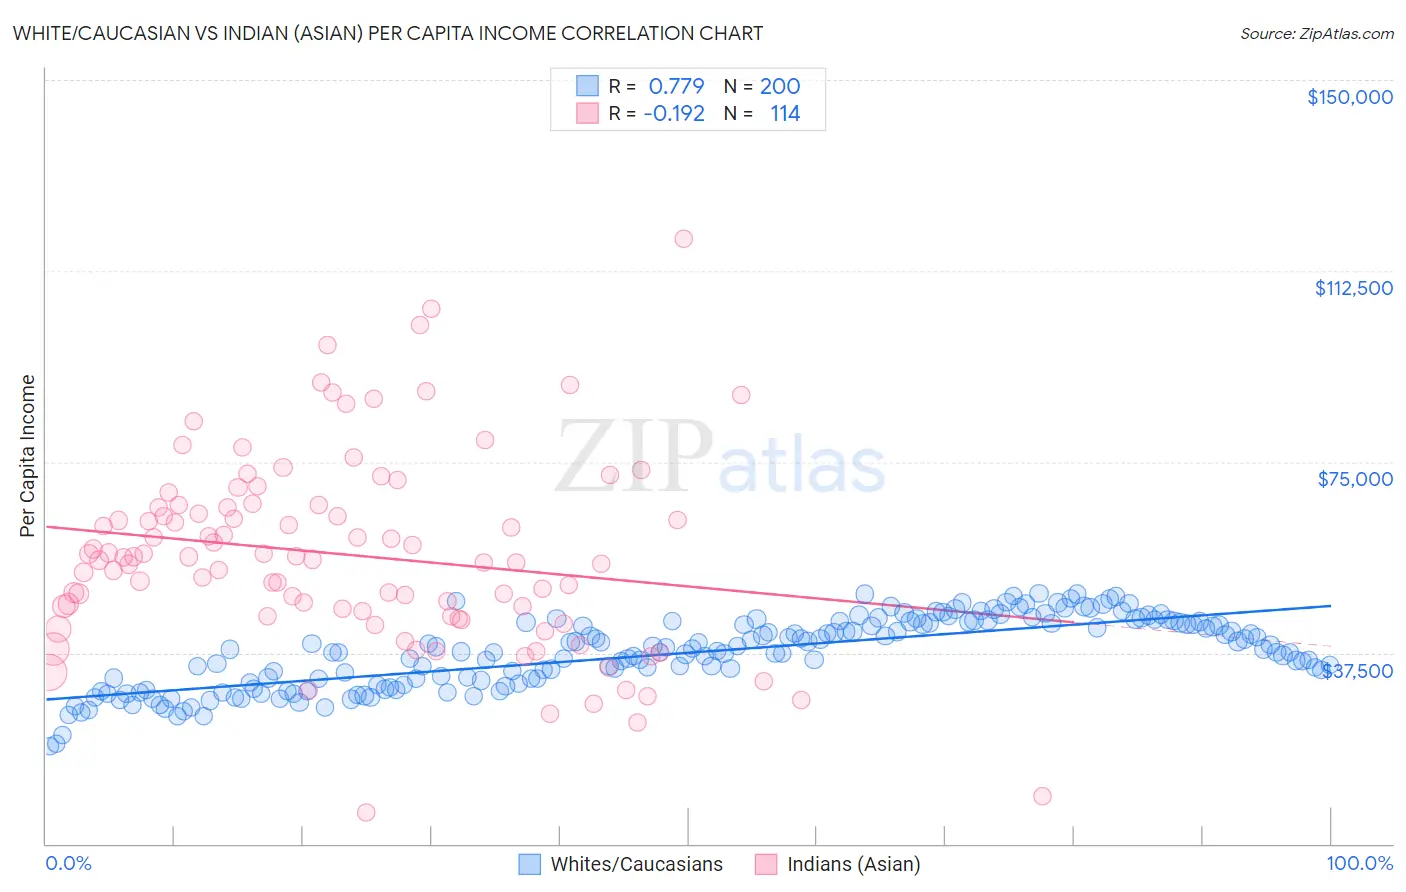
White/Caucasian vs Indian (Asian) Per Capita Income Correlation Chart

The statistical analysis conducted on geographies consisting of 585,276,990 people shows a strong positive correlation between the proportion of Whites/Caucasians and per capita income in the United States with a correlation coefficient (R) of 0.779 and weighted average of $42,180. Similarly, the statistical analysis conducted on geographies consisting of 495,399,283 people shows a poor negative correlation between the proportion of Indians (Asian) and per capita income in the United States with a correlation coefficient (R) of -0.192 and weighted average of $53,874, a difference of 27.7%.
White/Caucasian vs Indian (Asian) Per Capita Income

Per Capita Income Correlation Summary

MeasurementWhite/CaucasianIndian (Asian)
Minimum$19,081$6,086
Maximum$49,196$118,834
Range$30,115$112,748
Mean$37,504$56,707
Median$37,771$56,072
Interquartile 25% (IQ1)$31,862$44,771
Interquartile 75% (IQ3)$43,459$66,146
Interquartile Range (IQR)$11,597$21,374
Standard Deviation (Sample)$6,823$19,017
Standard Deviation (Population)$6,806$18,934

Similar Demographics by Per Capita Income

Demographics Similar to Whites/Caucasians by Per Capita Income

In terms of per capita income, the demographic groups most similar to Whites/Caucasians are Ghanaian ($42,164, a difference of 0.040%), Aleut ($42,210, a difference of 0.070%), Spanish ($42,249, a difference of 0.16%), Immigrants from Bosnia and Herzegovina ($42,278, a difference of 0.23%), and Venezuelan ($42,074, a difference of 0.25%).
DemographicsRating | RankPer Capita Income
Immigrants | Portugal
19.7
/100
|
#198
Poor
$42,412
Barbadians
19.6
/100
|
#199
Poor
$42,406
Vietnamese
19.0
/100
|
#200
Poor
$42,368
Immigrants | Thailand
17.6
/100
|
#201
Poor
$42,289
Immigrants | Bosnia and Herzegovina
17.5
/100
|
#202
Poor
$42,278
Spanish
17.0
/100
|
#203
Poor
$42,249
Aleuts
16.4
/100
|
#204
Poor
$42,210
Whites/Caucasians
15.9
/100
|
#205
Poor
$42,180
Ghanaians
15.7
/100
|
#206
Poor
$42,164
Venezuelans
14.4
/100
|
#207
Poor
$42,074
Panamanians
13.9
/100
|
#208
Poor
$42,035
Immigrants | Sudan
13.2
/100
|
#209
Poor
$41,986
Ecuadorians
12.9
/100
|
#210
Poor
$41,958
Immigrants | Panama
11.6
/100
|
#211
Poor
$41,853
Immigrants | Senegal
11.3
/100
|
#212
Poor
$41,830

Demographics Similar to Indians (Asian) by Per Capita Income

In terms of per capita income, the demographic groups most similar to Indians (Asian) are Immigrants from Eastern Asia ($53,806, a difference of 0.13%), Immigrants from Denmark ($53,799, a difference of 0.14%), Immigrants from Northern Europe ($54,159, a difference of 0.53%), Soviet Union ($54,202, a difference of 0.61%), and Immigrants from China ($54,264, a difference of 0.72%).
DemographicsRating | RankPer Capita Income
Cypriots
100.0
/100
|
#15
Exceptional
$54,899
Immigrants | Switzerland
100.0
/100
|
#16
Exceptional
$54,866
Immigrants | France
100.0
/100
|
#17
Exceptional
$54,557
Thais
100.0
/100
|
#18
Exceptional
$54,307
Immigrants | China
100.0
/100
|
#19
Exceptional
$54,264
Soviet Union
100.0
/100
|
#20
Exceptional
$54,202
Immigrants | Northern Europe
100.0
/100
|
#21
Exceptional
$54,159
Indians (Asian)
100.0
/100
|
#22
Exceptional
$53,874
Immigrants | Eastern Asia
100.0
/100
|
#23
Exceptional
$53,806
Immigrants | Denmark
100.0
/100
|
#24
Exceptional
$53,799
Immigrants | Japan
100.0
/100
|
#25
Exceptional
$53,359
Russians
100.0
/100
|
#26
Exceptional
$53,154
Immigrants | South Central Asia
100.0
/100
|
#27
Exceptional
$52,660
Latvians
100.0
/100
|
#28
Exceptional
$52,649
Israelis
100.0
/100
|
#29
Exceptional
$52,596