White/Caucasian vs Immigrants from Poland Per Capita Income
COMPARE
White/Caucasian
Immigrants from Poland
Per Capita Income
Per Capita Income Comparison
Whites/Caucasians
Immigrants from Poland
$42,180
PER CAPITA INCOME
15.9/ 100
METRIC RATING
205th/ 347
METRIC RANK
$45,979
PER CAPITA INCOME
93.1/ 100
METRIC RATING
119th/ 347
METRIC RANK
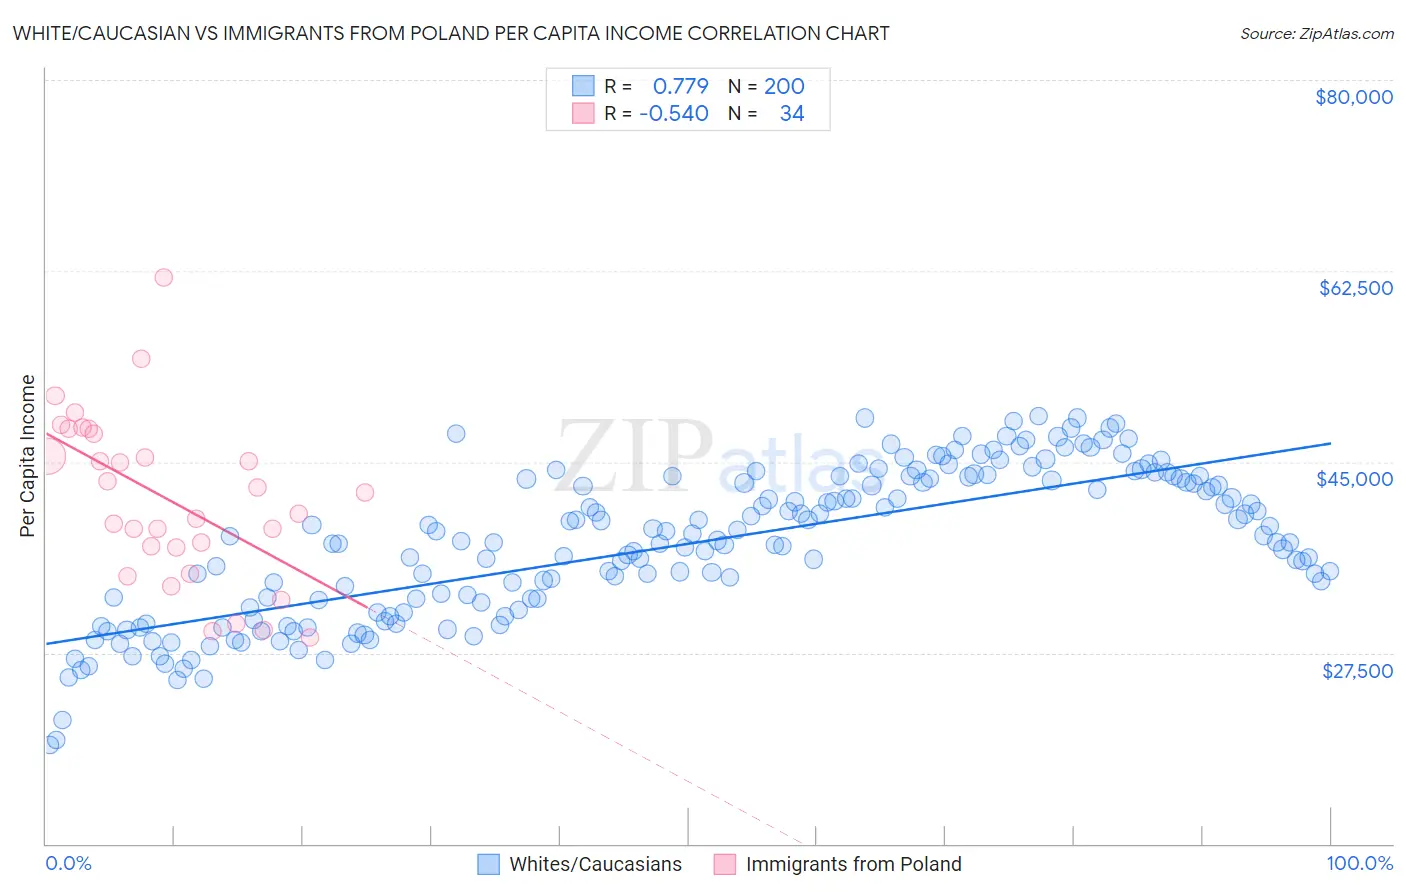
White/Caucasian vs Immigrants from Poland Per Capita Income Correlation Chart
The statistical analysis conducted on geographies consisting of 585,276,990 people shows a strong positive correlation between the proportion of Whites/Caucasians and per capita income in the United States with a correlation coefficient (R) of 0.779 and weighted average of $42,180. Similarly, the statistical analysis conducted on geographies consisting of 304,861,873 people shows a substantial negative correlation between the proportion of Immigrants from Poland and per capita income in the United States with a correlation coefficient (R) of -0.540 and weighted average of $45,979, a difference of 9.0%.
Per Capita Income Correlation Summary
| Measurement | White/Caucasian | Immigrants from Poland |
| Minimum | $19,081 | $28,915 |
| Maximum | $49,196 | $61,894 |
| Range | $30,115 | $32,979 |
| Mean | $37,504 | $41,553 |
| Median | $37,771 | $41,224 |
| Interquartile 25% (IQ1) | $31,862 | $37,111 |
| Interquartile 75% (IQ3) | $43,459 | $47,562 |
| Interquartile Range (IQR) | $11,597 | $10,451 |
| Standard Deviation (Sample) | $6,823 | $7,628 |
| Standard Deviation (Population) | $6,806 | $7,515 |
Similar Demographics by Per Capita Income
Demographics Similar to Whites/Caucasians by Per Capita Income
In terms of per capita income, the demographic groups most similar to Whites/Caucasians are Ghanaian ($42,164, a difference of 0.040%), Aleut ($42,210, a difference of 0.070%), Spanish ($42,249, a difference of 0.16%), Immigrants from Bosnia and Herzegovina ($42,278, a difference of 0.23%), and Venezuelan ($42,074, a difference of 0.25%).
| Demographics | Rating | Rank | Per Capita Income |
| Immigrants | Portugal | 19.7 /100 | #198 | Poor $42,412 |
| Barbadians | 19.6 /100 | #199 | Poor $42,406 |
| Vietnamese | 19.0 /100 | #200 | Poor $42,368 |
| Immigrants | Thailand | 17.6 /100 | #201 | Poor $42,289 |
| Immigrants | Bosnia and Herzegovina | 17.5 /100 | #202 | Poor $42,278 |
| Spanish | 17.0 /100 | #203 | Poor $42,249 |
| Aleuts | 16.4 /100 | #204 | Poor $42,210 |
| Whites/Caucasians | 15.9 /100 | #205 | Poor $42,180 |
| Ghanaians | 15.7 /100 | #206 | Poor $42,164 |
| Venezuelans | 14.4 /100 | #207 | Poor $42,074 |
| Panamanians | 13.9 /100 | #208 | Poor $42,035 |
| Immigrants | Sudan | 13.2 /100 | #209 | Poor $41,986 |
| Ecuadorians | 12.9 /100 | #210 | Poor $41,958 |
| Immigrants | Panama | 11.6 /100 | #211 | Poor $41,853 |
| Immigrants | Senegal | 11.3 /100 | #212 | Poor $41,830 |
Demographics Similar to Immigrants from Poland by Per Capita Income
In terms of per capita income, the demographic groups most similar to Immigrants from Poland are Immigrants from Saudi Arabia ($46,008, a difference of 0.060%), Immigrants from Ethiopia ($45,923, a difference of 0.12%), Chinese ($46,098, a difference of 0.26%), Canadian ($45,858, a difference of 0.27%), and Moroccan ($45,854, a difference of 0.27%).
| Demographics | Rating | Rank | Per Capita Income |
| Immigrants | Morocco | 95.7 /100 | #112 | Exceptional $46,430 |
| Immigrants | Albania | 95.5 /100 | #113 | Exceptional $46,387 |
| Afghans | 94.9 /100 | #114 | Exceptional $46,268 |
| Immigrants | Chile | 94.6 /100 | #115 | Exceptional $46,213 |
| Poles | 94.1 /100 | #116 | Exceptional $46,123 |
| Chinese | 93.9 /100 | #117 | Exceptional $46,098 |
| Immigrants | Saudi Arabia | 93.3 /100 | #118 | Exceptional $46,008 |
| Immigrants | Poland | 93.1 /100 | #119 | Exceptional $45,979 |
| Immigrants | Ethiopia | 92.7 /100 | #120 | Exceptional $45,923 |
| Canadians | 92.2 /100 | #121 | Exceptional $45,858 |
| Moroccans | 92.1 /100 | #122 | Exceptional $45,854 |
| Lebanese | 92.0 /100 | #123 | Exceptional $45,840 |
| Europeans | 92.0 /100 | #124 | Exceptional $45,836 |
| Zimbabweans | 91.7 /100 | #125 | Exceptional $45,804 |
| Palestinians | 91.6 /100 | #126 | Exceptional $45,790 |