Yup'ik vs Immigrants from Oceania Wage/Income Gap
COMPARE
Yup'ik
Immigrants from Oceania
Wage/Income Gap
Wage/Income Gap Comparison
Yup'ik
Immigrants from Oceania
24.7%
WAGE/INCOME GAP
93.3/ 100
METRIC RATING
129th/ 347
METRIC RANK
25.6%
WAGE/INCOME GAP
57.5/ 100
METRIC RATING
170th/ 347
METRIC RANK
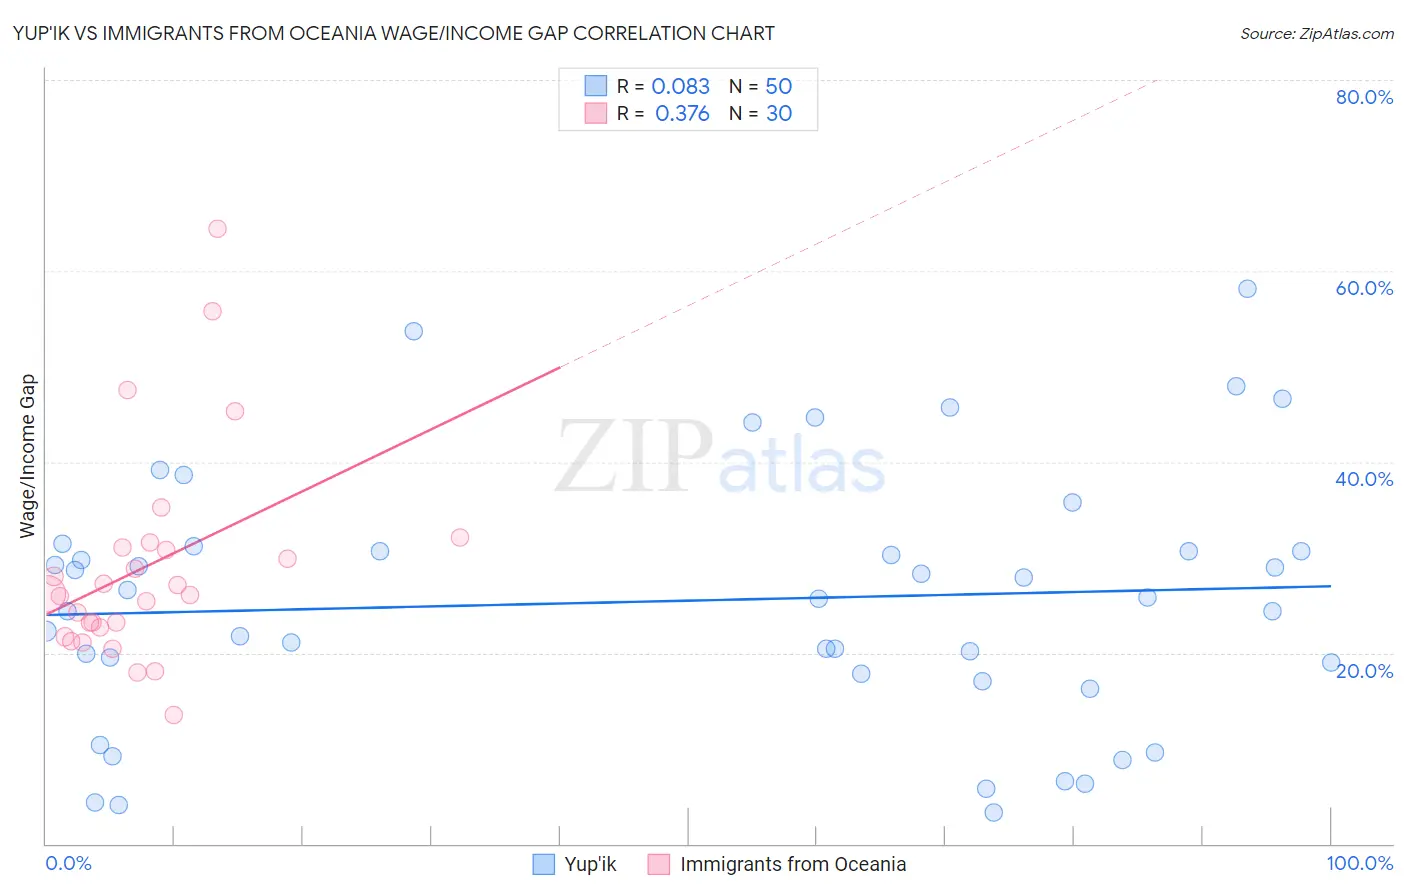
Yup'ik vs Immigrants from Oceania Wage/Income Gap Correlation Chart
The statistical analysis conducted on geographies consisting of 39,932,187 people shows a slight positive correlation between the proportion of Yup'ik and wage/income gap percentage in the United States with a correlation coefficient (R) of 0.083 and weighted average of 24.7%. Similarly, the statistical analysis conducted on geographies consisting of 305,340,706 people shows a mild positive correlation between the proportion of Immigrants from Oceania and wage/income gap percentage in the United States with a correlation coefficient (R) of 0.376 and weighted average of 25.6%, a difference of 4.0%.
Wage/Income Gap Correlation Summary
| Measurement | Yup'ik | Immigrants from Oceania |
| Minimum | 3.3% | 13.4% |
| Maximum | 58.1% | 64.4% |
| Range | 54.8% | 50.9% |
| Mean | 25.4% | 29.0% |
| Median | 25.7% | 26.1% |
| Interquartile 25% (IQ1) | 17.8% | 22.7% |
| Interquartile 75% (IQ3) | 30.6% | 31.1% |
| Interquartile Range (IQR) | 12.8% | 8.4% |
| Standard Deviation (Sample) | 13.3% | 11.1% |
| Standard Deviation (Population) | 13.1% | 10.9% |
Similar Demographics by Wage/Income Gap
Demographics Similar to Yup'ik by Wage/Income Gap
In terms of wage/income gap, the demographic groups most similar to Yup'ik are Alsatian (24.7%, a difference of 0.020%), Immigrants from Central America (24.6%, a difference of 0.050%), Immigrants from Philippines (24.7%, a difference of 0.090%), German Russian (24.6%, a difference of 0.12%), and Immigrants from Uruguay (24.6%, a difference of 0.13%).
| Demographics | Rating | Rank | Wage/Income Gap |
| Apache | 94.8 /100 | #122 | Exceptional 24.5% |
| Natives/Alaskans | 94.6 /100 | #123 | Exceptional 24.6% |
| Immigrants | South America | 93.9 /100 | #124 | Exceptional 24.6% |
| Spanish Americans | 93.8 /100 | #125 | Exceptional 24.6% |
| Immigrants | Uruguay | 93.8 /100 | #126 | Exceptional 24.6% |
| German Russians | 93.7 /100 | #127 | Exceptional 24.6% |
| Immigrants | Central America | 93.5 /100 | #128 | Exceptional 24.6% |
| Yup'ik | 93.3 /100 | #129 | Exceptional 24.7% |
| Alsatians | 93.2 /100 | #130 | Exceptional 24.7% |
| Immigrants | Philippines | 93.0 /100 | #131 | Exceptional 24.7% |
| Immigrants | Costa Rica | 92.4 /100 | #132 | Exceptional 24.7% |
| Colombians | 92.4 /100 | #133 | Exceptional 24.7% |
| Mexican American Indians | 92.2 /100 | #134 | Exceptional 24.7% |
| South American Indians | 92.0 /100 | #135 | Exceptional 24.7% |
| Armenians | 91.3 /100 | #136 | Exceptional 24.8% |
Demographics Similar to Immigrants from Oceania by Wage/Income Gap
In terms of wage/income gap, the demographic groups most similar to Immigrants from Oceania are Immigrants from Greece (25.7%, a difference of 0.060%), Peruvian (25.6%, a difference of 0.17%), Immigrants from Chile (25.7%, a difference of 0.28%), Immigrants from Belarus (25.7%, a difference of 0.31%), and Seminole (25.6%, a difference of 0.35%).
| Demographics | Rating | Rank | Wage/Income Gap |
| Native Hawaiians | 69.0 /100 | #163 | Good 25.4% |
| Koreans | 68.6 /100 | #164 | Good 25.4% |
| Immigrants | Hong Kong | 64.0 /100 | #165 | Good 25.5% |
| Immigrants | Ukraine | 63.8 /100 | #166 | Good 25.5% |
| Paiute | 62.9 /100 | #167 | Good 25.5% |
| Seminole | 62.6 /100 | #168 | Good 25.6% |
| Peruvians | 60.1 /100 | #169 | Good 25.6% |
| Immigrants | Oceania | 57.5 /100 | #170 | Average 25.6% |
| Immigrants | Greece | 56.6 /100 | #171 | Average 25.7% |
| Immigrants | Chile | 53.2 /100 | #172 | Average 25.7% |
| Immigrants | Belarus | 52.9 /100 | #173 | Average 25.7% |
| Alaskan Athabascans | 50.0 /100 | #174 | Average 25.8% |
| Sri Lankans | 47.0 /100 | #175 | Average 25.8% |
| Paraguayans | 46.7 /100 | #176 | Average 25.8% |
| Cambodians | 45.1 /100 | #177 | Average 25.8% |