Yup'ik vs Immigrants from Eritrea Wage/Income Gap
COMPARE
Yup'ik
Immigrants from Eritrea
Wage/Income Gap
Wage/Income Gap Comparison
Yup'ik
Immigrants from Eritrea
24.7%
WAGE/INCOME GAP
93.3/ 100
METRIC RATING
129th/ 347
METRIC RANK
21.4%
WAGE/INCOME GAP
100.0/ 100
METRIC RATING
44th/ 347
METRIC RANK
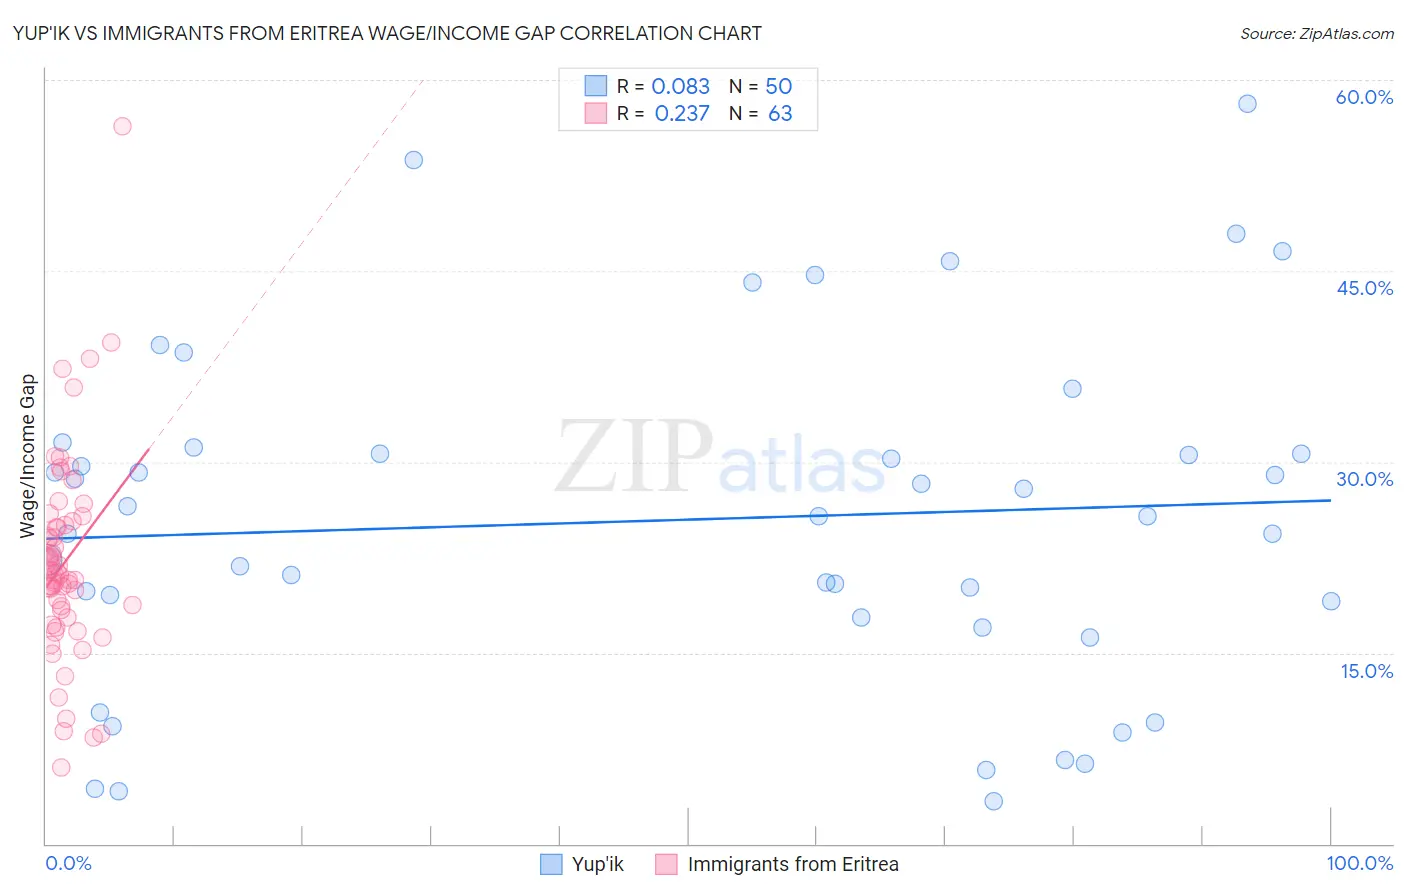
Yup'ik vs Immigrants from Eritrea Wage/Income Gap Correlation Chart
The statistical analysis conducted on geographies consisting of 39,932,187 people shows a slight positive correlation between the proportion of Yup'ik and wage/income gap percentage in the United States with a correlation coefficient (R) of 0.083 and weighted average of 24.7%. Similarly, the statistical analysis conducted on geographies consisting of 104,849,653 people shows a weak positive correlation between the proportion of Immigrants from Eritrea and wage/income gap percentage in the United States with a correlation coefficient (R) of 0.237 and weighted average of 21.4%, a difference of 15.0%.
Wage/Income Gap Correlation Summary
| Measurement | Yup'ik | Immigrants from Eritrea |
| Minimum | 3.3% | 6.0% |
| Maximum | 58.1% | 56.4% |
| Range | 54.8% | 50.4% |
| Mean | 25.4% | 22.2% |
| Median | 25.7% | 21.1% |
| Interquartile 25% (IQ1) | 17.8% | 17.7% |
| Interquartile 75% (IQ3) | 30.6% | 25.3% |
| Interquartile Range (IQR) | 12.8% | 7.6% |
| Standard Deviation (Sample) | 13.3% | 8.2% |
| Standard Deviation (Population) | 13.1% | 8.1% |
Similar Demographics by Wage/Income Gap
Demographics Similar to Yup'ik by Wage/Income Gap
In terms of wage/income gap, the demographic groups most similar to Yup'ik are Alsatian (24.7%, a difference of 0.020%), Immigrants from Central America (24.6%, a difference of 0.050%), Immigrants from Philippines (24.7%, a difference of 0.090%), German Russian (24.6%, a difference of 0.12%), and Immigrants from Uruguay (24.6%, a difference of 0.13%).
| Demographics | Rating | Rank | Wage/Income Gap |
| Apache | 94.8 /100 | #122 | Exceptional 24.5% |
| Natives/Alaskans | 94.6 /100 | #123 | Exceptional 24.6% |
| Immigrants | South America | 93.9 /100 | #124 | Exceptional 24.6% |
| Spanish Americans | 93.8 /100 | #125 | Exceptional 24.6% |
| Immigrants | Uruguay | 93.8 /100 | #126 | Exceptional 24.6% |
| German Russians | 93.7 /100 | #127 | Exceptional 24.6% |
| Immigrants | Central America | 93.5 /100 | #128 | Exceptional 24.6% |
| Yup'ik | 93.3 /100 | #129 | Exceptional 24.7% |
| Alsatians | 93.2 /100 | #130 | Exceptional 24.7% |
| Immigrants | Philippines | 93.0 /100 | #131 | Exceptional 24.7% |
| Immigrants | Costa Rica | 92.4 /100 | #132 | Exceptional 24.7% |
| Colombians | 92.4 /100 | #133 | Exceptional 24.7% |
| Mexican American Indians | 92.2 /100 | #134 | Exceptional 24.7% |
| South American Indians | 92.0 /100 | #135 | Exceptional 24.7% |
| Armenians | 91.3 /100 | #136 | Exceptional 24.8% |
Demographics Similar to Immigrants from Eritrea by Wage/Income Gap
In terms of wage/income gap, the demographic groups most similar to Immigrants from Eritrea are Sierra Leonean (21.4%, a difference of 0.020%), Liberian (21.4%, a difference of 0.080%), Immigrants from Sierra Leone (21.4%, a difference of 0.080%), U.S. Virgin Islander (21.5%, a difference of 0.44%), and Lumbee (21.3%, a difference of 0.56%).
| Demographics | Rating | Rank | Wage/Income Gap |
| Immigrants | Somalia | 100.0 /100 | #37 | Exceptional 21.2% |
| Immigrants | Belize | 100.0 /100 | #38 | Exceptional 21.3% |
| Colville | 100.0 /100 | #39 | Exceptional 21.3% |
| Lumbee | 100.0 /100 | #40 | Exceptional 21.3% |
| Liberians | 100.0 /100 | #41 | Exceptional 21.4% |
| Immigrants | Sierra Leone | 100.0 /100 | #42 | Exceptional 21.4% |
| Sierra Leoneans | 100.0 /100 | #43 | Exceptional 21.4% |
| Immigrants | Eritrea | 100.0 /100 | #44 | Exceptional 21.4% |
| U.S. Virgin Islanders | 100.0 /100 | #45 | Exceptional 21.5% |
| Immigrants | Ethiopia | 100.0 /100 | #46 | Exceptional 21.6% |
| Immigrants | Congo | 100.0 /100 | #47 | Exceptional 21.7% |
| Blacks/African Americans | 100.0 /100 | #48 | Exceptional 21.7% |
| Ethiopians | 100.0 /100 | #49 | Exceptional 21.8% |
| Immigrants | Western Africa | 100.0 /100 | #50 | Exceptional 22.0% |
| Tohono O'odham | 100.0 /100 | #51 | Exceptional 22.1% |