Jordanian vs Immigrants from Eritrea Wage/Income Gap
COMPARE
Jordanian
Immigrants from Eritrea
Wage/Income Gap
Wage/Income Gap Comparison
Jordanians
Immigrants from Eritrea
26.8%
WAGE/INCOME GAP
8.0/ 100
METRIC RATING
223rd/ 347
METRIC RANK
21.4%
WAGE/INCOME GAP
100.0/ 100
METRIC RATING
44th/ 347
METRIC RANK
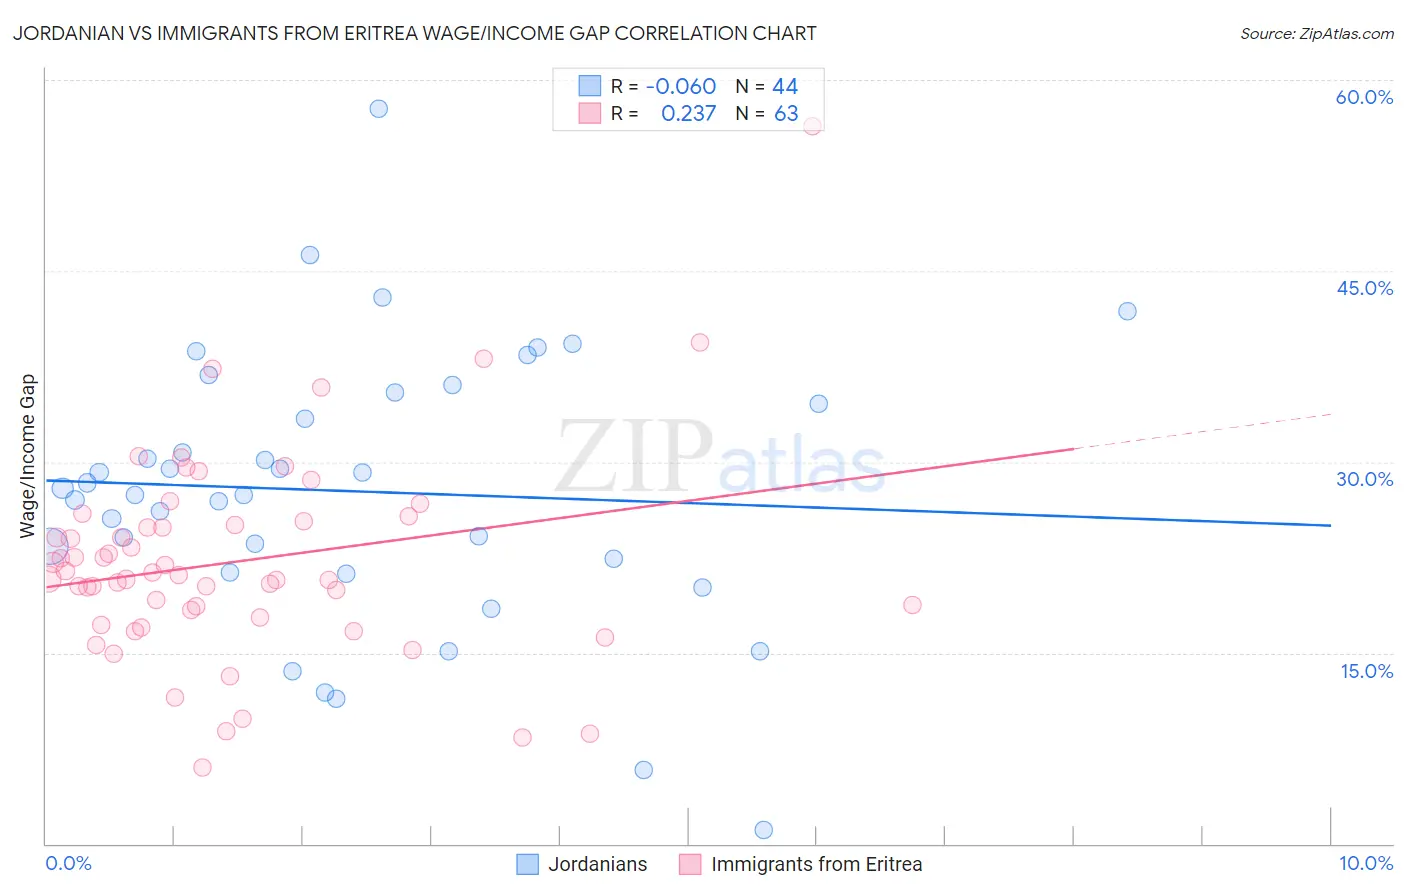
Jordanian vs Immigrants from Eritrea Wage/Income Gap Correlation Chart
The statistical analysis conducted on geographies consisting of 166,410,383 people shows a slight negative correlation between the proportion of Jordanians and wage/income gap percentage in the United States with a correlation coefficient (R) of -0.060 and weighted average of 26.8%. Similarly, the statistical analysis conducted on geographies consisting of 104,849,653 people shows a weak positive correlation between the proportion of Immigrants from Eritrea and wage/income gap percentage in the United States with a correlation coefficient (R) of 0.237 and weighted average of 21.4%, a difference of 24.9%.
Wage/Income Gap Correlation Summary
| Measurement | Jordanian | Immigrants from Eritrea |
| Minimum | 1.1% | 6.0% |
| Maximum | 57.8% | 56.4% |
| Range | 56.7% | 50.4% |
| Mean | 27.7% | 22.2% |
| Median | 27.7% | 21.1% |
| Interquartile 25% (IQ1) | 21.8% | 17.7% |
| Interquartile 75% (IQ3) | 35.0% | 25.3% |
| Interquartile Range (IQR) | 13.2% | 7.6% |
| Standard Deviation (Sample) | 10.8% | 8.2% |
| Standard Deviation (Population) | 10.7% | 8.1% |
Similar Demographics by Wage/Income Gap
Demographics Similar to Jordanians by Wage/Income Gap
In terms of wage/income gap, the demographic groups most similar to Jordanians are Bolivian (26.8%, a difference of 0.070%), Immigrants from Spain (26.8%, a difference of 0.11%), Immigrants from Argentina (26.8%, a difference of 0.17%), Immigrants from Latvia (26.7%, a difference of 0.18%), and Immigrants from Poland (26.7%, a difference of 0.19%).
| Demographics | Rating | Rank | Wage/Income Gap |
| Immigrants | Portugal | 9.5 /100 | #216 | Tragic 26.7% |
| Brazilians | 9.2 /100 | #217 | Tragic 26.7% |
| Immigrants | Saudi Arabia | 9.1 /100 | #218 | Tragic 26.7% |
| Immigrants | Poland | 8.9 /100 | #219 | Tragic 26.7% |
| Immigrants | Latvia | 8.9 /100 | #220 | Tragic 26.7% |
| Immigrants | Spain | 8.5 /100 | #221 | Tragic 26.8% |
| Bolivians | 8.3 /100 | #222 | Tragic 26.8% |
| Jordanians | 8.0 /100 | #223 | Tragic 26.8% |
| Immigrants | Argentina | 7.2 /100 | #224 | Tragic 26.8% |
| Immigrants | Ireland | 6.5 /100 | #225 | Tragic 26.9% |
| Asians | 5.9 /100 | #226 | Tragic 26.9% |
| Spaniards | 5.6 /100 | #227 | Tragic 27.0% |
| Immigrants | Turkey | 5.6 /100 | #228 | Tragic 27.0% |
| Immigrants | Asia | 5.5 /100 | #229 | Tragic 27.0% |
| Ottawa | 5.3 /100 | #230 | Tragic 27.0% |
Demographics Similar to Immigrants from Eritrea by Wage/Income Gap
In terms of wage/income gap, the demographic groups most similar to Immigrants from Eritrea are Sierra Leonean (21.4%, a difference of 0.020%), Liberian (21.4%, a difference of 0.080%), Immigrants from Sierra Leone (21.4%, a difference of 0.080%), U.S. Virgin Islander (21.5%, a difference of 0.44%), and Lumbee (21.3%, a difference of 0.56%).
| Demographics | Rating | Rank | Wage/Income Gap |
| Immigrants | Somalia | 100.0 /100 | #37 | Exceptional 21.2% |
| Immigrants | Belize | 100.0 /100 | #38 | Exceptional 21.3% |
| Colville | 100.0 /100 | #39 | Exceptional 21.3% |
| Lumbee | 100.0 /100 | #40 | Exceptional 21.3% |
| Liberians | 100.0 /100 | #41 | Exceptional 21.4% |
| Immigrants | Sierra Leone | 100.0 /100 | #42 | Exceptional 21.4% |
| Sierra Leoneans | 100.0 /100 | #43 | Exceptional 21.4% |
| Immigrants | Eritrea | 100.0 /100 | #44 | Exceptional 21.4% |
| U.S. Virgin Islanders | 100.0 /100 | #45 | Exceptional 21.5% |
| Immigrants | Ethiopia | 100.0 /100 | #46 | Exceptional 21.6% |
| Immigrants | Congo | 100.0 /100 | #47 | Exceptional 21.7% |
| Blacks/African Americans | 100.0 /100 | #48 | Exceptional 21.7% |
| Ethiopians | 100.0 /100 | #49 | Exceptional 21.8% |
| Immigrants | Western Africa | 100.0 /100 | #50 | Exceptional 22.0% |
| Tohono O'odham | 100.0 /100 | #51 | Exceptional 22.1% |