Yup'ik vs Immigrants from Eritrea Poverty
COMPARE
Yup'ik
Immigrants from Eritrea
Poverty
Poverty Comparison
Yup'ik
Immigrants from Eritrea
20.8%
POVERTY
0.0/ 100
METRIC RATING
340th/ 347
METRIC RANK
13.4%
POVERTY
2.4/ 100
METRIC RATING
224th/ 347
METRIC RANK
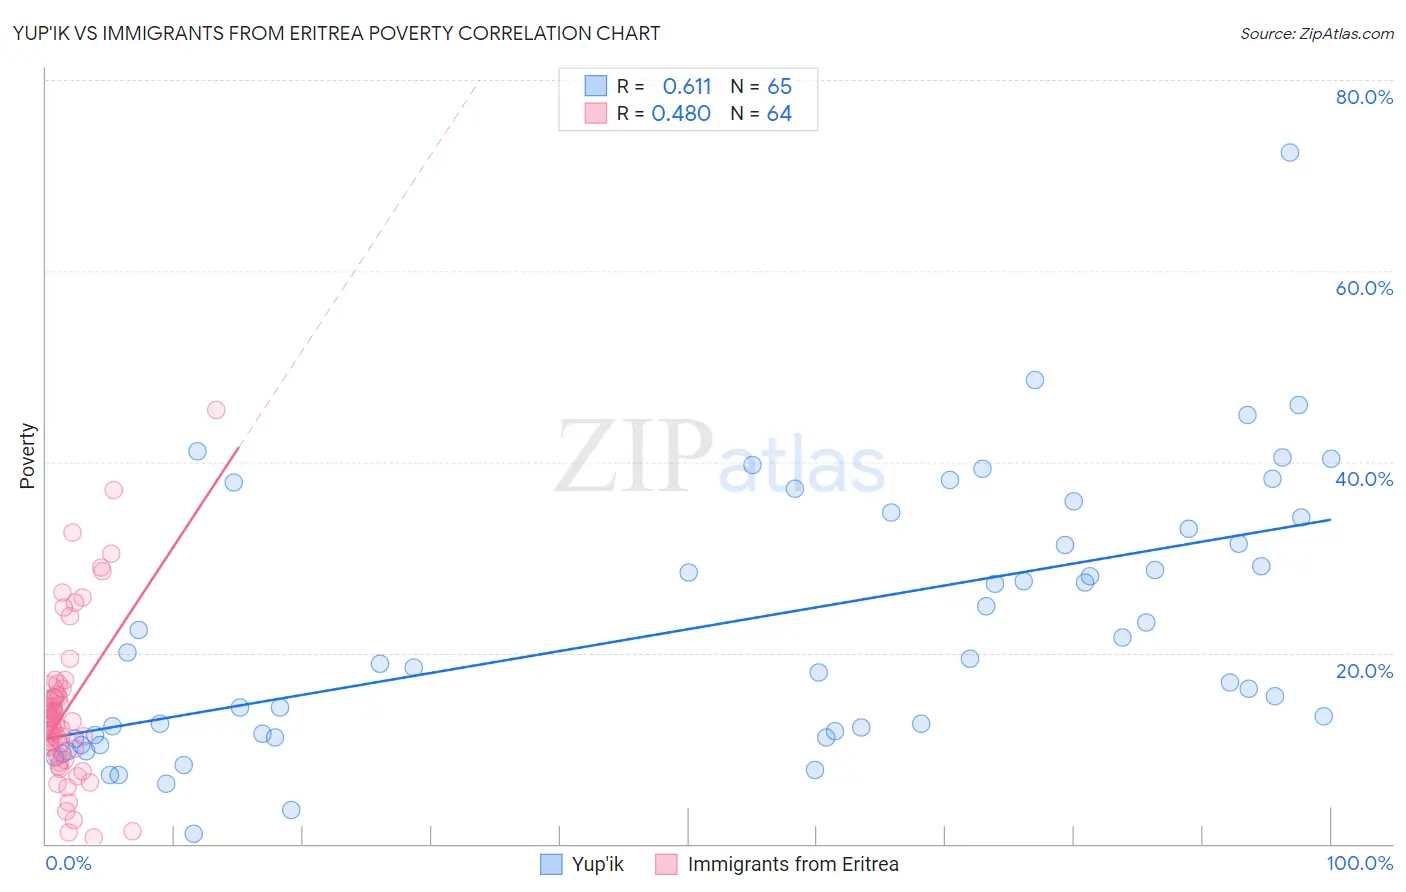
Yup'ik vs Immigrants from Eritrea Poverty Correlation Chart
The statistical analysis conducted on geographies consisting of 39,963,253 people shows a significant positive correlation between the proportion of Yup'ik and poverty level in the United States with a correlation coefficient (R) of 0.611 and weighted average of 20.8%. Similarly, the statistical analysis conducted on geographies consisting of 104,846,826 people shows a moderate positive correlation between the proportion of Immigrants from Eritrea and poverty level in the United States with a correlation coefficient (R) of 0.480 and weighted average of 13.4%, a difference of 55.1%.
Poverty Correlation Summary
| Measurement | Yup'ik | Immigrants from Eritrea |
| Minimum | 1.1% | 0.62% |
| Maximum | 72.4% | 45.5% |
| Range | 71.3% | 44.8% |
| Mean | 22.6% | 14.2% |
| Median | 18.9% | 12.6% |
| Interquartile 25% (IQ1) | 11.3% | 9.5% |
| Interquartile 75% (IQ3) | 33.5% | 16.0% |
| Interquartile Range (IQR) | 22.3% | 6.4% |
| Standard Deviation (Sample) | 13.8% | 8.6% |
| Standard Deviation (Population) | 13.7% | 8.5% |
Similar Demographics by Poverty
Demographics Similar to Yup'ik by Poverty
In terms of poverty, the demographic groups most similar to Yup'ik are Hopi (20.8%, a difference of 0.18%), Crow (20.7%, a difference of 0.75%), Yuman (20.2%, a difference of 3.0%), Immigrants from Yemen (21.5%, a difference of 3.4%), and Pima (21.9%, a difference of 5.0%).
| Demographics | Rating | Rank | Poverty |
| Houma | 0.0 /100 | #333 | Tragic 18.4% |
| Apache | 0.0 /100 | #334 | Tragic 18.4% |
| Cheyenne | 0.0 /100 | #335 | Tragic 18.9% |
| Pueblo | 0.0 /100 | #336 | Tragic 19.4% |
| Sioux | 0.0 /100 | #337 | Tragic 19.8% |
| Yuman | 0.0 /100 | #338 | Tragic 20.2% |
| Crow | 0.0 /100 | #339 | Tragic 20.7% |
| Yup'ik | 0.0 /100 | #340 | Tragic 20.8% |
| Hopi | 0.0 /100 | #341 | Tragic 20.8% |
| Immigrants | Yemen | 0.0 /100 | #342 | Tragic 21.5% |
| Pima | 0.0 /100 | #343 | Tragic 21.9% |
| Lumbee | 0.0 /100 | #344 | Tragic 21.9% |
| Navajo | 0.0 /100 | #345 | Tragic 23.1% |
| Puerto Ricans | 0.0 /100 | #346 | Tragic 23.7% |
| Tohono O'odham | 0.0 /100 | #347 | Tragic 24.4% |
Demographics Similar to Immigrants from Eritrea by Poverty
In terms of poverty, the demographic groups most similar to Immigrants from Eritrea are Immigrants from Africa (13.4%, a difference of 0.10%), Immigrants from Micronesia (13.4%, a difference of 0.14%), Alsatian (13.4%, a difference of 0.18%), German Russian (13.4%, a difference of 0.22%), and Marshallese (13.4%, a difference of 0.23%).
| Demographics | Rating | Rank | Poverty |
| Immigrants | Uzbekistan | 3.2 /100 | #217 | Tragic 13.3% |
| Immigrants | Thailand | 3.1 /100 | #218 | Tragic 13.3% |
| Immigrants | Cambodia | 3.0 /100 | #219 | Tragic 13.4% |
| Americans | 2.9 /100 | #220 | Tragic 13.4% |
| Alsatians | 2.6 /100 | #221 | Tragic 13.4% |
| Immigrants | Micronesia | 2.6 /100 | #222 | Tragic 13.4% |
| Immigrants | Africa | 2.5 /100 | #223 | Tragic 13.4% |
| Immigrants | Eritrea | 2.4 /100 | #224 | Tragic 13.4% |
| German Russians | 2.2 /100 | #225 | Tragic 13.4% |
| Marshallese | 2.2 /100 | #226 | Tragic 13.4% |
| Alaska Natives | 2.1 /100 | #227 | Tragic 13.5% |
| Immigrants | Nigeria | 1.7 /100 | #228 | Tragic 13.5% |
| Osage | 1.5 /100 | #229 | Tragic 13.6% |
| Alaskan Athabascans | 1.5 /100 | #230 | Tragic 13.6% |
| Nigerians | 1.4 /100 | #231 | Tragic 13.6% |