Yup'ik vs Immigrants from Eritrea Child Poverty Among Boys Under 16
COMPARE
Yup'ik
Immigrants from Eritrea
Child Poverty Among Boys Under 16
Child Poverty Among Boys Under 16 Comparison
Yup'ik
Immigrants from Eritrea
24.7%
CHILD POVERTY AMONG BOYS UNDER 16
0.0/ 100
METRIC RATING
335th/ 347
METRIC RANK
18.6%
CHILD POVERTY AMONG BOYS UNDER 16
0.8/ 100
METRIC RATING
237th/ 347
METRIC RANK
Yup'ik vs Immigrants from Eritrea Child Poverty Among Boys Under 16 Correlation Chart
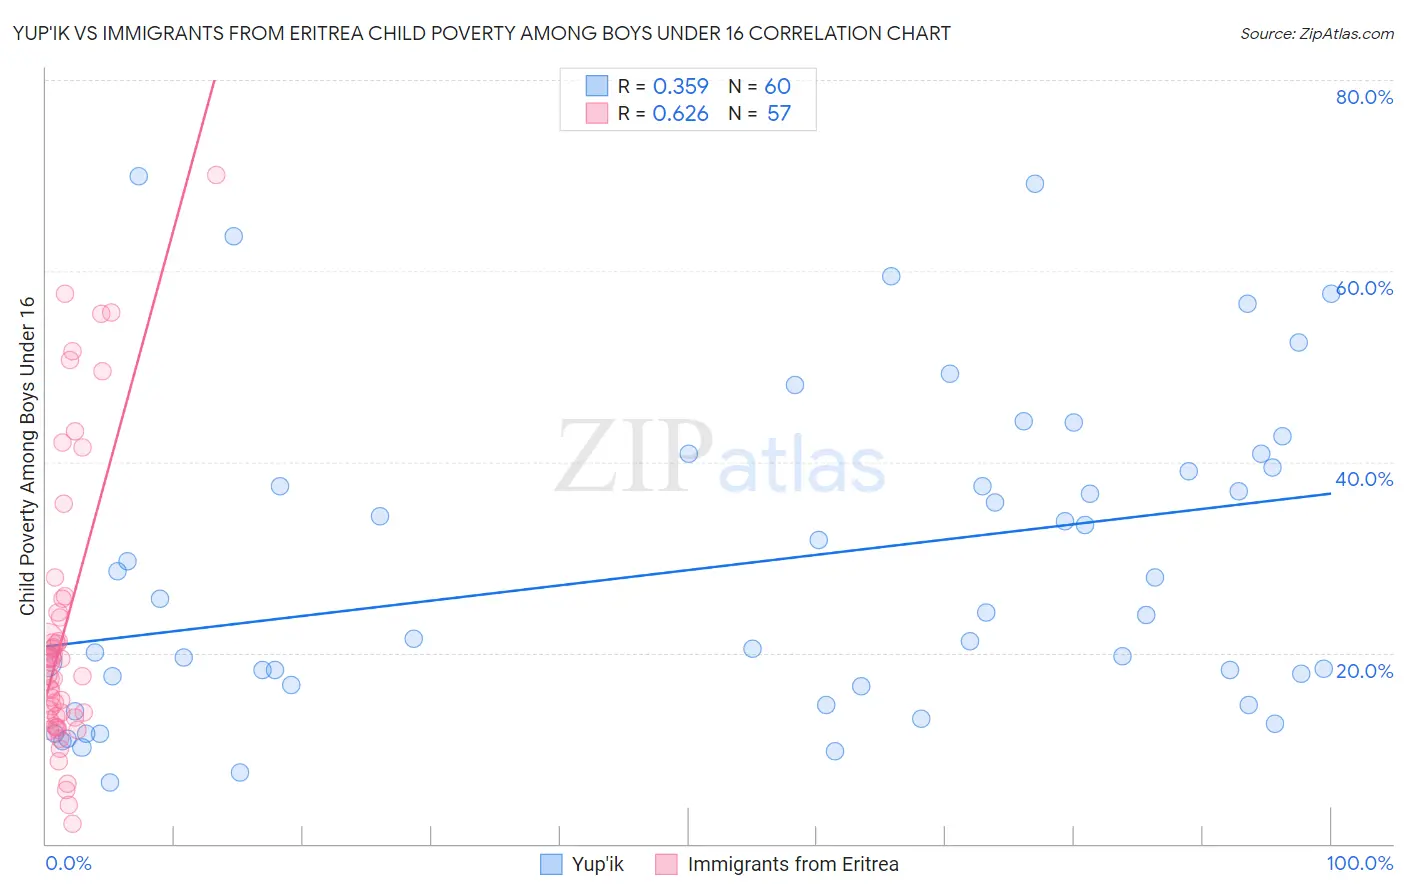
The statistical analysis conducted on geographies consisting of 39,797,465 people shows a mild positive correlation between the proportion of Yup'ik and poverty level among boys under the age of 16 in the United States with a correlation coefficient (R) of 0.359 and weighted average of 24.7%. Similarly, the statistical analysis conducted on geographies consisting of 104,677,274 people shows a significant positive correlation between the proportion of Immigrants from Eritrea and poverty level among boys under the age of 16 in the United States with a correlation coefficient (R) of 0.626 and weighted average of 18.6%, a difference of 32.8%.
Child Poverty Among Boys Under 16 Correlation Summary
| Measurement | Yup'ik | Immigrants from Eritrea |
| Minimum | 6.4% | 2.0% |
| Maximum | 69.9% | 70.0% |
| Range | 63.5% | 68.0% |
| Mean | 28.9% | 22.5% |
| Median | 24.1% | 17.7% |
| Interquartile 25% (IQ1) | 16.6% | 13.1% |
| Interquartile 75% (IQ3) | 39.2% | 24.9% |
| Interquartile Range (IQR) | 22.6% | 11.8% |
| Standard Deviation (Sample) | 16.4% | 15.2% |
| Standard Deviation (Population) | 16.3% | 15.0% |
Similar Demographics by Child Poverty Among Boys Under 16
Demographics Similar to Yup'ik by Child Poverty Among Boys Under 16
In terms of child poverty among boys under 16, the demographic groups most similar to Yup'ik are Black/African American (24.5%, a difference of 0.85%), Apache (24.5%, a difference of 0.97%), Immigrants from Dominican Republic (24.3%, a difference of 1.7%), Dominican (24.2%, a difference of 2.3%), and Sioux (25.3%, a difference of 2.3%).
| Demographics | Rating | Rank | Child Poverty Among Boys Under 16 |
| Pueblo | 0.0 /100 | #328 | Tragic 23.5% |
| Natives/Alaskans | 0.0 /100 | #329 | Tragic 24.0% |
| Colville | 0.0 /100 | #330 | Tragic 24.1% |
| Dominicans | 0.0 /100 | #331 | Tragic 24.2% |
| Immigrants | Dominican Republic | 0.0 /100 | #332 | Tragic 24.3% |
| Apache | 0.0 /100 | #333 | Tragic 24.5% |
| Blacks/African Americans | 0.0 /100 | #334 | Tragic 24.5% |
| Yup'ik | 0.0 /100 | #335 | Tragic 24.7% |
| Sioux | 0.0 /100 | #336 | Tragic 25.3% |
| Cheyenne | 0.0 /100 | #337 | Tragic 25.8% |
| Hopi | 0.0 /100 | #338 | Tragic 25.9% |
| Houma | 0.0 /100 | #339 | Tragic 26.2% |
| Crow | 0.0 /100 | #340 | Tragic 26.3% |
| Immigrants | Yemen | 0.0 /100 | #341 | Tragic 28.9% |
| Pima | 0.0 /100 | #342 | Tragic 29.7% |
Demographics Similar to Immigrants from Eritrea by Child Poverty Among Boys Under 16
In terms of child poverty among boys under 16, the demographic groups most similar to Immigrants from Eritrea are Sudanese (18.6%, a difference of 0.15%), Immigrants from Laos (18.7%, a difference of 0.22%), American (18.6%, a difference of 0.24%), Cape Verdean (18.7%, a difference of 0.45%), and Nigerian (18.5%, a difference of 0.74%).
| Demographics | Rating | Rank | Child Poverty Among Boys Under 16 |
| Fijians | 1.8 /100 | #230 | Tragic 18.3% |
| Nicaraguans | 1.4 /100 | #231 | Tragic 18.4% |
| Marshallese | 1.3 /100 | #232 | Tragic 18.4% |
| Immigrants | Nigeria | 1.2 /100 | #233 | Tragic 18.4% |
| Nigerians | 1.1 /100 | #234 | Tragic 18.5% |
| Americans | 0.9 /100 | #235 | Tragic 18.6% |
| Sudanese | 0.9 /100 | #236 | Tragic 18.6% |
| Immigrants | Eritrea | 0.8 /100 | #237 | Tragic 18.6% |
| Immigrants | Laos | 0.8 /100 | #238 | Tragic 18.7% |
| Cape Verdeans | 0.7 /100 | #239 | Tragic 18.7% |
| Immigrants | Cuba | 0.6 /100 | #240 | Tragic 18.8% |
| Immigrants | Sudan | 0.6 /100 | #241 | Tragic 18.8% |
| Ghanaians | 0.5 /100 | #242 | Tragic 18.9% |
| Immigrants | Azores | 0.4 /100 | #243 | Tragic 18.9% |
| Immigrants | Middle Africa | 0.4 /100 | #244 | Tragic 18.9% |