Yup'ik vs Immigrants from Eritrea 2 or more Vehicles in Household
COMPARE
Yup'ik
Immigrants from Eritrea
2 or more Vehicles in Household
2 or more Vehicles in Household Comparison
Yup'ik
Immigrants from Eritrea
34.9%
2 OR MORE VEHICLES IN HOUSEHOLD
0.0/ 100
METRIC RATING
344th/ 347
METRIC RANK
52.6%
2 OR MORE VEHICLES IN HOUSEHOLD
0.7/ 100
METRIC RATING
256th/ 347
METRIC RANK
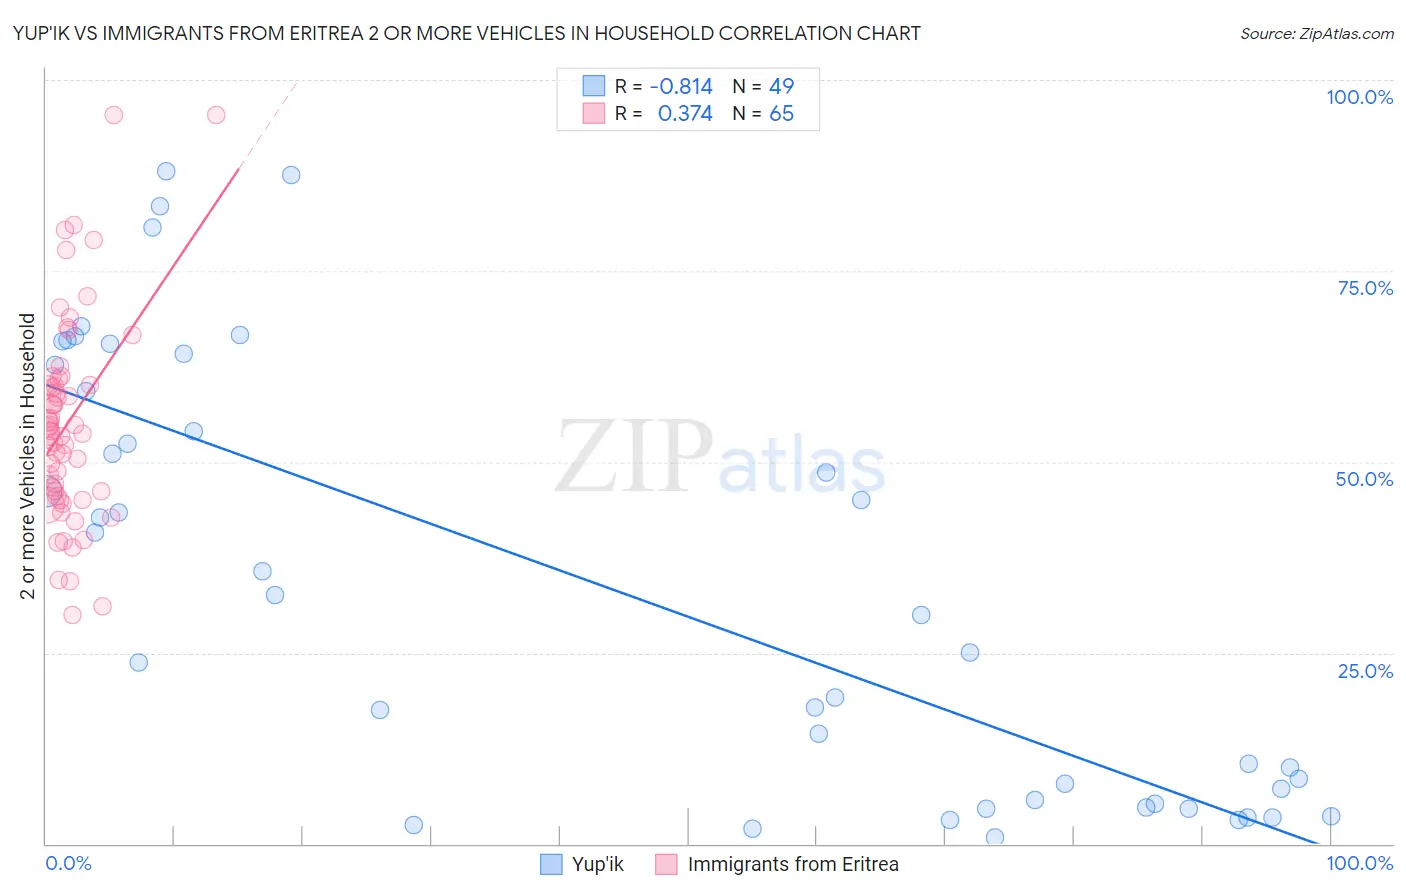
Yup'ik vs Immigrants from Eritrea 2 or more Vehicles in Household Correlation Chart
The statistical analysis conducted on geographies consisting of 39,935,819 people shows a very strong negative correlation between the proportion of Yup'ik and percentage of households with 2 or more vehicles available in the United States with a correlation coefficient (R) of -0.814 and weighted average of 34.9%. Similarly, the statistical analysis conducted on geographies consisting of 104,847,164 people shows a mild positive correlation between the proportion of Immigrants from Eritrea and percentage of households with 2 or more vehicles available in the United States with a correlation coefficient (R) of 0.374 and weighted average of 52.6%, a difference of 50.6%.
2 or more Vehicles in Household Correlation Summary
| Measurement | Yup'ik | Immigrants from Eritrea |
| Minimum | 0.83% | 30.0% |
| Maximum | 88.1% | 95.5% |
| Range | 87.3% | 65.4% |
| Mean | 33.8% | 55.1% |
| Median | 29.9% | 54.0% |
| Interquartile 25% (IQ1) | 5.5% | 45.8% |
| Interquartile 75% (IQ3) | 61.0% | 60.5% |
| Interquartile Range (IQR) | 55.5% | 14.7% |
| Standard Deviation (Sample) | 27.9% | 13.5% |
| Standard Deviation (Population) | 27.6% | 13.4% |
Similar Demographics by 2 or more Vehicles in Household
Demographics Similar to Yup'ik by 2 or more Vehicles in Household
In terms of 2 or more vehicles in household, the demographic groups most similar to Yup'ik are Immigrants from Guyana (35.0%, a difference of 0.17%), Dominican (35.3%, a difference of 1.1%), Guyanese (35.4%, a difference of 1.2%), British West Indian (35.4%, a difference of 1.3%), and Immigrants from Barbados (35.8%, a difference of 2.4%).
| Demographics | Rating | Rank | 2 or more Vehicles in Household |
| Immigrants | Ecuador | 0.0 /100 | #333 | Tragic 40.5% |
| Immigrants | Trinidad and Tobago | 0.0 /100 | #334 | Tragic 40.3% |
| Immigrants | Bangladesh | 0.0 /100 | #335 | Tragic 38.8% |
| Vietnamese | 0.0 /100 | #336 | Tragic 38.5% |
| Barbadians | 0.0 /100 | #337 | Tragic 38.3% |
| Immigrants | Uzbekistan | 0.0 /100 | #338 | Tragic 37.9% |
| Immigrants | Barbados | 0.0 /100 | #339 | Tragic 35.8% |
| British West Indians | 0.0 /100 | #340 | Tragic 35.4% |
| Guyanese | 0.0 /100 | #341 | Tragic 35.4% |
| Dominicans | 0.0 /100 | #342 | Tragic 35.3% |
| Immigrants | Guyana | 0.0 /100 | #343 | Tragic 35.0% |
| Yup'ik | 0.0 /100 | #344 | Tragic 34.9% |
| Immigrants | Dominican Republic | 0.0 /100 | #345 | Tragic 33.2% |
| Immigrants | St. Vincent and the Grenadines | 0.0 /100 | #346 | Tragic 31.0% |
| Immigrants | Grenada | 0.0 /100 | #347 | Tragic 28.7% |
Demographics Similar to Immigrants from Eritrea by 2 or more Vehicles in Household
In terms of 2 or more vehicles in household, the demographic groups most similar to Immigrants from Eritrea are Uruguayan (52.7%, a difference of 0.040%), Immigrants from Malaysia (52.7%, a difference of 0.070%), Immigrants from Hong Kong (52.6%, a difference of 0.14%), Central American Indian (52.5%, a difference of 0.24%), and Nigerian (52.8%, a difference of 0.26%).
| Demographics | Rating | Rank | 2 or more Vehicles in Household |
| Immigrants | Brazil | 1.0 /100 | #249 | Tragic 52.8% |
| Mongolians | 1.0 /100 | #250 | Tragic 52.8% |
| Immigrants | Sudan | 1.0 /100 | #251 | Tragic 52.8% |
| Immigrants | Portugal | 1.0 /100 | #252 | Tragic 52.8% |
| Nigerians | 0.9 /100 | #253 | Tragic 52.8% |
| Immigrants | Malaysia | 0.8 /100 | #254 | Tragic 52.7% |
| Uruguayans | 0.7 /100 | #255 | Tragic 52.7% |
| Immigrants | Eritrea | 0.7 /100 | #256 | Tragic 52.6% |
| Immigrants | Hong Kong | 0.6 /100 | #257 | Tragic 52.6% |
| Central American Indians | 0.6 /100 | #258 | Tragic 52.5% |
| Alsatians | 0.6 /100 | #259 | Tragic 52.5% |
| Immigrants | Bahamas | 0.5 /100 | #260 | Tragic 52.5% |
| Immigrants | Australia | 0.5 /100 | #261 | Tragic 52.4% |
| Immigrants | Northern Africa | 0.4 /100 | #262 | Tragic 52.3% |
| Immigrants | Southern Europe | 0.4 /100 | #263 | Tragic 52.3% |