Celtic vs Immigrants from Eritrea Wage/Income Gap
COMPARE
Celtic
Immigrants from Eritrea
Wage/Income Gap
Wage/Income Gap Comparison
Celtics
Immigrants from Eritrea
27.3%
WAGE/INCOME GAP
2.8/ 100
METRIC RATING
247th/ 347
METRIC RANK
21.4%
WAGE/INCOME GAP
100.0/ 100
METRIC RATING
44th/ 347
METRIC RANK
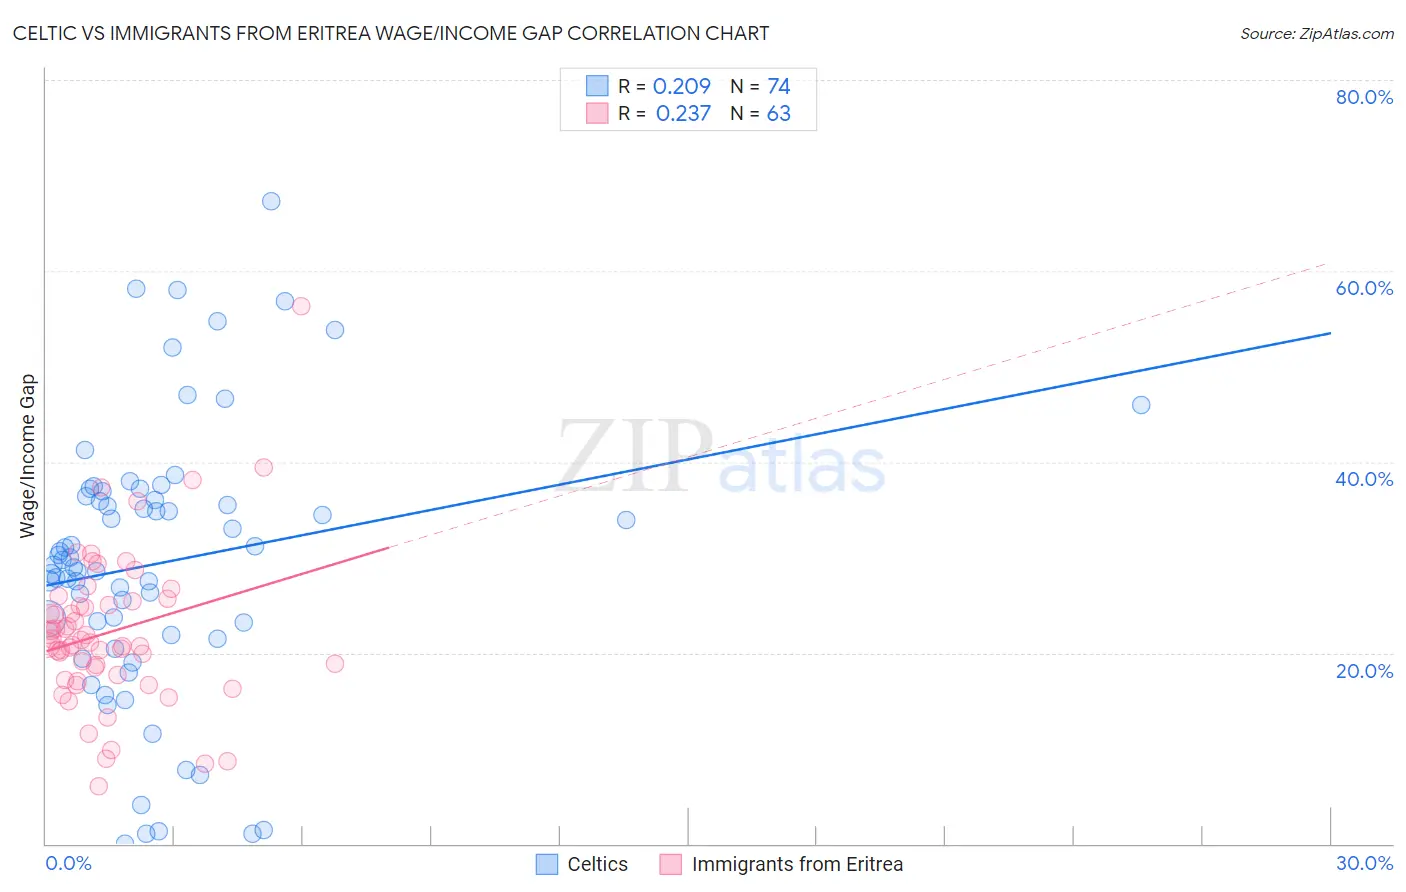
Celtic vs Immigrants from Eritrea Wage/Income Gap Correlation Chart
The statistical analysis conducted on geographies consisting of 168,805,315 people shows a weak positive correlation between the proportion of Celtics and wage/income gap percentage in the United States with a correlation coefficient (R) of 0.209 and weighted average of 27.3%. Similarly, the statistical analysis conducted on geographies consisting of 104,849,653 people shows a weak positive correlation between the proportion of Immigrants from Eritrea and wage/income gap percentage in the United States with a correlation coefficient (R) of 0.237 and weighted average of 21.4%, a difference of 27.1%.
Wage/Income Gap Correlation Summary
| Measurement | Celtic | Immigrants from Eritrea |
| Minimum | 0.040% | 6.0% |
| Maximum | 67.3% | 56.4% |
| Range | 67.3% | 50.4% |
| Mean | 29.4% | 22.2% |
| Median | 29.5% | 21.1% |
| Interquartile 25% (IQ1) | 21.9% | 17.7% |
| Interquartile 75% (IQ3) | 36.4% | 25.3% |
| Interquartile Range (IQR) | 14.5% | 7.6% |
| Standard Deviation (Sample) | 14.3% | 8.2% |
| Standard Deviation (Population) | 14.2% | 8.1% |
Similar Demographics by Wage/Income Gap
Demographics Similar to Celtics by Wage/Income Gap
In terms of wage/income gap, the demographic groups most similar to Celtics are Cypriot (27.3%, a difference of 0.010%), Carpatho Rusyn (27.3%, a difference of 0.020%), Immigrants from Czechoslovakia (27.3%, a difference of 0.030%), Immigrants from Norway (27.3%, a difference of 0.14%), and Ukrainian (27.3%, a difference of 0.20%).
| Demographics | Rating | Rank | Wage/Income Gap |
| Immigrants | Europe | 3.8 /100 | #240 | Tragic 27.1% |
| Creek | 3.8 /100 | #241 | Tragic 27.1% |
| Immigrants | Sri Lanka | 3.7 /100 | #242 | Tragic 27.1% |
| Spanish | 3.6 /100 | #243 | Tragic 27.1% |
| Chickasaw | 3.5 /100 | #244 | Tragic 27.2% |
| Immigrants | Azores | 3.5 /100 | #245 | Tragic 27.2% |
| Immigrants | Nonimmigrants | 3.3 /100 | #246 | Tragic 27.2% |
| Celtics | 2.8 /100 | #247 | Tragic 27.3% |
| Cypriots | 2.8 /100 | #248 | Tragic 27.3% |
| Carpatho Rusyns | 2.7 /100 | #249 | Tragic 27.3% |
| Immigrants | Czechoslovakia | 2.7 /100 | #250 | Tragic 27.3% |
| Immigrants | Norway | 2.5 /100 | #251 | Tragic 27.3% |
| Ukrainians | 2.4 /100 | #252 | Tragic 27.3% |
| Portuguese | 2.2 /100 | #253 | Tragic 27.4% |
| Israelis | 2.1 /100 | #254 | Tragic 27.4% |
Demographics Similar to Immigrants from Eritrea by Wage/Income Gap
In terms of wage/income gap, the demographic groups most similar to Immigrants from Eritrea are Sierra Leonean (21.4%, a difference of 0.020%), Liberian (21.4%, a difference of 0.080%), Immigrants from Sierra Leone (21.4%, a difference of 0.080%), U.S. Virgin Islander (21.5%, a difference of 0.44%), and Lumbee (21.3%, a difference of 0.56%).
| Demographics | Rating | Rank | Wage/Income Gap |
| Immigrants | Somalia | 100.0 /100 | #37 | Exceptional 21.2% |
| Immigrants | Belize | 100.0 /100 | #38 | Exceptional 21.3% |
| Colville | 100.0 /100 | #39 | Exceptional 21.3% |
| Lumbee | 100.0 /100 | #40 | Exceptional 21.3% |
| Liberians | 100.0 /100 | #41 | Exceptional 21.4% |
| Immigrants | Sierra Leone | 100.0 /100 | #42 | Exceptional 21.4% |
| Sierra Leoneans | 100.0 /100 | #43 | Exceptional 21.4% |
| Immigrants | Eritrea | 100.0 /100 | #44 | Exceptional 21.4% |
| U.S. Virgin Islanders | 100.0 /100 | #45 | Exceptional 21.5% |
| Immigrants | Ethiopia | 100.0 /100 | #46 | Exceptional 21.6% |
| Immigrants | Congo | 100.0 /100 | #47 | Exceptional 21.7% |
| Blacks/African Americans | 100.0 /100 | #48 | Exceptional 21.7% |
| Ethiopians | 100.0 /100 | #49 | Exceptional 21.8% |
| Immigrants | Western Africa | 100.0 /100 | #50 | Exceptional 22.0% |
| Tohono O'odham | 100.0 /100 | #51 | Exceptional 22.1% |