Welsh vs Immigrants from Jordan Median Household Income
COMPARE
Welsh
Immigrants from Jordan
Median Household Income
Median Household Income Comparison
Welsh
Immigrants from Jordan
$83,628
MEDIAN HOUSEHOLD INCOME
28.0/ 100
METRIC RATING
192nd/ 347
METRIC RANK
$89,412
MEDIAN HOUSEHOLD INCOME
94.1/ 100
METRIC RATING
124th/ 347
METRIC RANK
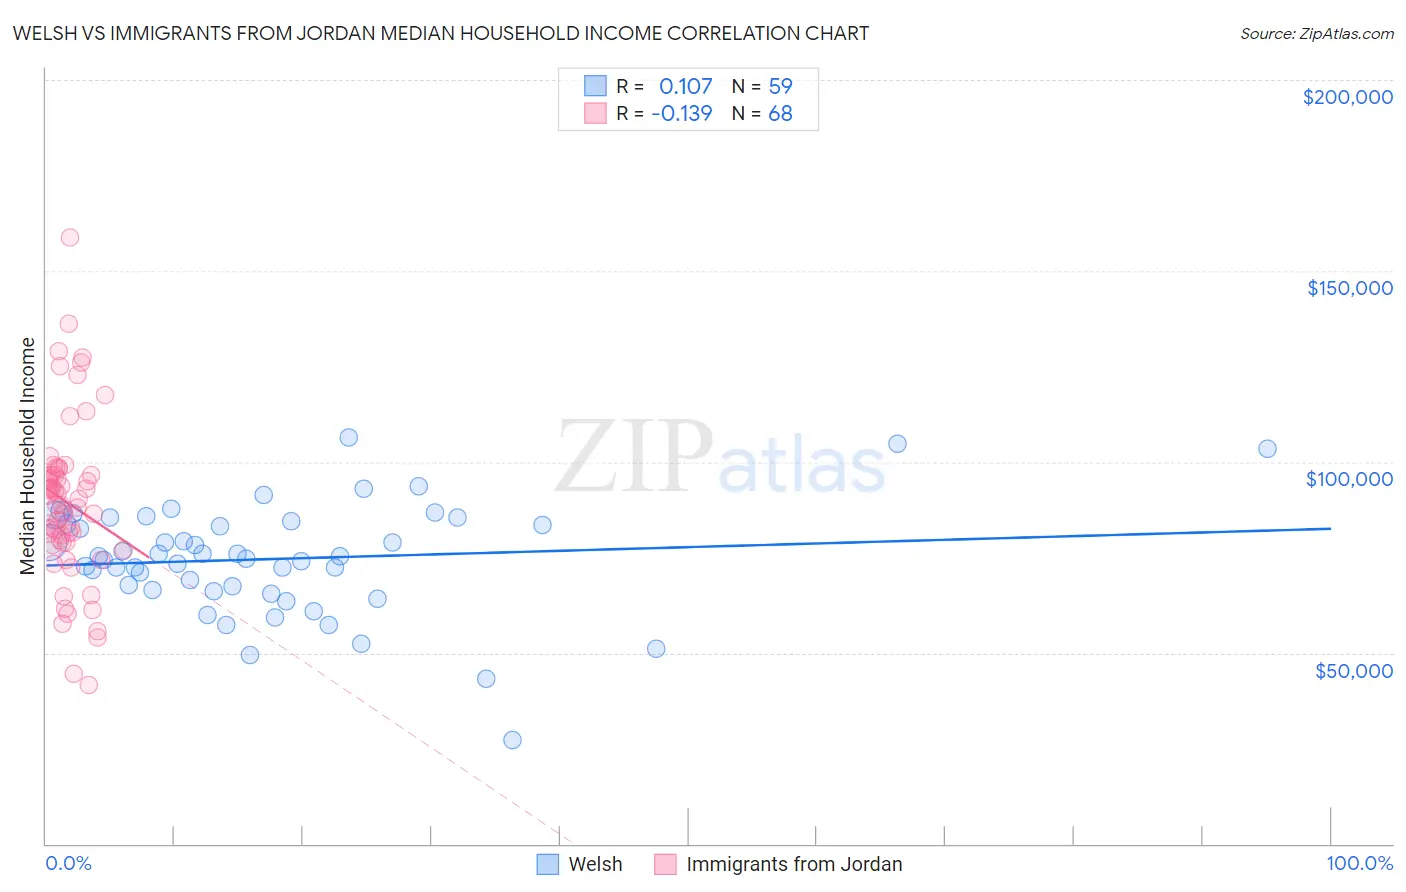
Welsh vs Immigrants from Jordan Median Household Income Correlation Chart
The statistical analysis conducted on geographies consisting of 527,928,431 people shows a poor positive correlation between the proportion of Welsh and median household income in the United States with a correlation coefficient (R) of 0.107 and weighted average of $83,628. Similarly, the statistical analysis conducted on geographies consisting of 181,227,500 people shows a poor negative correlation between the proportion of Immigrants from Jordan and median household income in the United States with a correlation coefficient (R) of -0.139 and weighted average of $89,412, a difference of 6.9%.
Median Household Income Correlation Summary
| Measurement | Welsh | Immigrants from Jordan |
| Minimum | $27,188 | $41,486 |
| Maximum | $106,528 | $158,906 |
| Range | $79,340 | $117,420 |
| Mean | $74,552 | $89,344 |
| Median | $75,263 | $89,581 |
| Interquartile 25% (IQ1) | $66,384 | $78,846 |
| Interquartile 75% (IQ3) | $84,494 | $96,669 |
| Interquartile Range (IQR) | $18,110 | $17,823 |
| Standard Deviation (Sample) | $14,468 | $21,166 |
| Standard Deviation (Population) | $14,345 | $21,010 |
Similar Demographics by Median Household Income
Demographics Similar to Welsh by Median Household Income
In terms of median household income, the demographic groups most similar to Welsh are Finnish ($83,607, a difference of 0.030%), Ghanaian ($83,582, a difference of 0.060%), Immigrants from Armenia ($83,555, a difference of 0.090%), Iraqi ($83,753, a difference of 0.15%), and French ($83,468, a difference of 0.19%).
| Demographics | Rating | Rank | Median Household Income |
| Kenyans | 34.2 /100 | #185 | Fair $84,085 |
| Puget Sound Salish | 33.2 /100 | #186 | Fair $84,011 |
| Belgians | 33.2 /100 | #187 | Fair $84,008 |
| Tlingit-Haida | 32.6 /100 | #188 | Fair $83,968 |
| Immigrants | Colombia | 31.7 /100 | #189 | Fair $83,902 |
| Slovaks | 30.2 /100 | #190 | Fair $83,798 |
| Iraqis | 29.6 /100 | #191 | Fair $83,753 |
| Welsh | 28.0 /100 | #192 | Fair $83,628 |
| Finns | 27.7 /100 | #193 | Fair $83,607 |
| Ghanaians | 27.4 /100 | #194 | Fair $83,582 |
| Immigrants | Armenia | 27.0 /100 | #195 | Fair $83,555 |
| French | 26.0 /100 | #196 | Fair $83,468 |
| Aleuts | 25.7 /100 | #197 | Fair $83,446 |
| Japanese | 25.1 /100 | #198 | Fair $83,395 |
| Germans | 24.6 /100 | #199 | Fair $83,358 |
Demographics Similar to Immigrants from Jordan by Median Household Income
In terms of median household income, the demographic groups most similar to Immigrants from Jordan are Immigrants from Zimbabwe ($89,496, a difference of 0.090%), Immigrants from Kuwait ($89,263, a difference of 0.17%), Ethiopian ($89,640, a difference of 0.25%), Pakistani ($89,638, a difference of 0.25%), and Immigrants from Oceania ($89,100, a difference of 0.35%).
| Demographics | Rating | Rank | Median Household Income |
| Taiwanese | 95.6 /100 | #117 | Exceptional $89,900 |
| Syrians | 95.4 /100 | #118 | Exceptional $89,830 |
| Albanians | 95.2 /100 | #119 | Exceptional $89,744 |
| Immigrants | North Macedonia | 95.2 /100 | #120 | Exceptional $89,741 |
| Ethiopians | 94.9 /100 | #121 | Exceptional $89,640 |
| Pakistanis | 94.8 /100 | #122 | Exceptional $89,638 |
| Immigrants | Zimbabwe | 94.4 /100 | #123 | Exceptional $89,496 |
| Immigrants | Jordan | 94.1 /100 | #124 | Exceptional $89,412 |
| Immigrants | Kuwait | 93.5 /100 | #125 | Exceptional $89,263 |
| Immigrants | Oceania | 92.9 /100 | #126 | Exceptional $89,100 |
| Immigrants | Peru | 92.5 /100 | #127 | Exceptional $89,010 |
| Portuguese | 92.3 /100 | #128 | Exceptional $88,976 |
| Brazilians | 92.1 /100 | #129 | Exceptional $88,934 |
| British | 92.0 /100 | #130 | Exceptional $88,914 |
| Immigrants | Syria | 91.4 /100 | #131 | Exceptional $88,792 |