Welsh vs Immigrants from Mexico GED/Equivalency
COMPARE
Welsh
Immigrants from Mexico
GED/Equivalency
GED/Equivalency Comparison
Welsh
Immigrants from Mexico
87.4%
GED/EQUIVALENCY
97.9/ 100
METRIC RATING
90th/ 347
METRIC RANK
75.7%
GED/EQUIVALENCY
0.0/ 100
METRIC RATING
345th/ 347
METRIC RANK
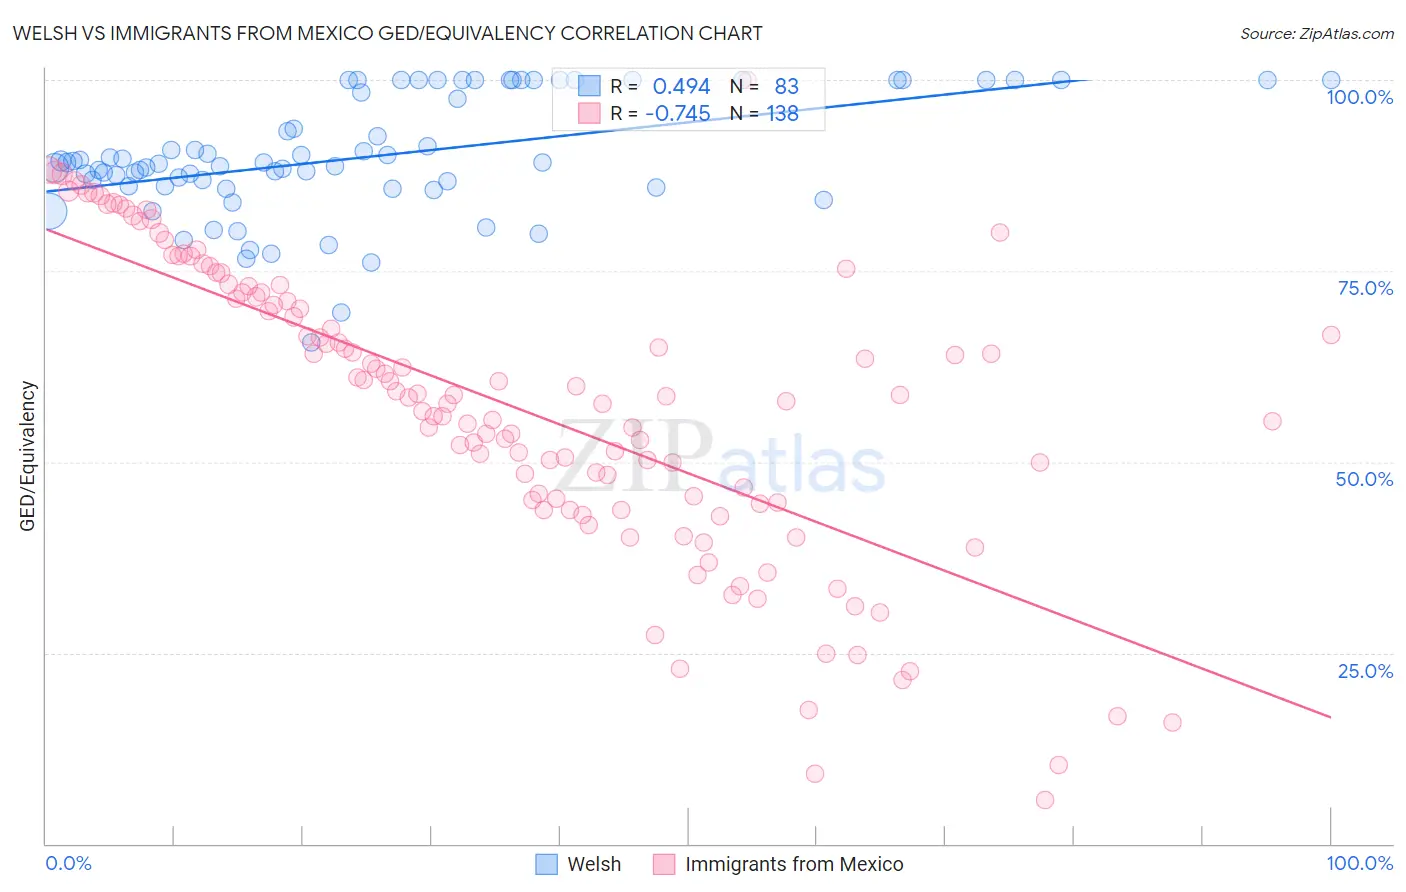
Welsh vs Immigrants from Mexico GED/Equivalency Correlation Chart
The statistical analysis conducted on geographies consisting of 528,596,196 people shows a moderate positive correlation between the proportion of Welsh and percentage of population with at least ged/equivalency education in the United States with a correlation coefficient (R) of 0.494 and weighted average of 87.4%. Similarly, the statistical analysis conducted on geographies consisting of 513,765,067 people shows a strong negative correlation between the proportion of Immigrants from Mexico and percentage of population with at least ged/equivalency education in the United States with a correlation coefficient (R) of -0.745 and weighted average of 75.7%, a difference of 15.6%.
GED/Equivalency Correlation Summary
| Measurement | Welsh | Immigrants from Mexico |
| Minimum | 65.7% | 5.7% |
| Maximum | 100.0% | 100.0% |
| Range | 34.3% | 94.3% |
| Mean | 90.0% | 57.5% |
| Median | 89.2% | 58.6% |
| Interquartile 25% (IQ1) | 86.1% | 45.0% |
| Interquartile 75% (IQ3) | 100.0% | 72.2% |
| Interquartile Range (IQR) | 13.9% | 27.3% |
| Standard Deviation (Sample) | 7.9% | 19.4% |
| Standard Deviation (Population) | 7.8% | 19.4% |
Similar Demographics by GED/Equivalency
Demographics Similar to Welsh by GED/Equivalency
In terms of ged/equivalency, the demographic groups most similar to Welsh are Hungarian (87.4%, a difference of 0.0%), Immigrants from Eastern Asia (87.4%, a difference of 0.010%), Israeli (87.4%, a difference of 0.020%), Immigrants from North Macedonia (87.4%, a difference of 0.030%), and Immigrants from Russia (87.4%, a difference of 0.030%).
| Demographics | Rating | Rank | GED/Equivalency |
| South Africans | 98.3 /100 | #83 | Exceptional 87.5% |
| Immigrants | Romania | 98.1 /100 | #84 | Exceptional 87.5% |
| Dutch | 98.1 /100 | #85 | Exceptional 87.5% |
| Immigrants | Europe | 98.1 /100 | #86 | Exceptional 87.5% |
| Native Hawaiians | 98.1 /100 | #87 | Exceptional 87.5% |
| Immigrants | Norway | 98.1 /100 | #88 | Exceptional 87.5% |
| Hungarians | 97.9 /100 | #89 | Exceptional 87.4% |
| Welsh | 97.9 /100 | #90 | Exceptional 87.4% |
| Immigrants | Eastern Asia | 97.9 /100 | #91 | Exceptional 87.4% |
| Israelis | 97.8 /100 | #92 | Exceptional 87.4% |
| Immigrants | North Macedonia | 97.8 /100 | #93 | Exceptional 87.4% |
| Immigrants | Russia | 97.8 /100 | #94 | Exceptional 87.4% |
| Immigrants | Greece | 97.7 /100 | #95 | Exceptional 87.4% |
| Czechoslovakians | 97.6 /100 | #96 | Exceptional 87.4% |
| Immigrants | Western Europe | 97.3 /100 | #97 | Exceptional 87.3% |
Demographics Similar to Immigrants from Mexico by GED/Equivalency
In terms of ged/equivalency, the demographic groups most similar to Immigrants from Mexico are Spanish American Indian (76.3%, a difference of 0.89%), Immigrants from Central America (76.4%, a difference of 0.92%), Houma (75.0%, a difference of 0.94%), Pima (76.4%, a difference of 1.0%), and Yakama (74.5%, a difference of 1.6%).
| Demographics | Rating | Rank | GED/Equivalency |
| Salvadorans | 0.0 /100 | #333 | Tragic 78.6% |
| Guatemalans | 0.0 /100 | #334 | Tragic 78.5% |
| Immigrants | Latin America | 0.0 /100 | #335 | Tragic 78.5% |
| Immigrants | Dominican Republic | 0.0 /100 | #336 | Tragic 78.0% |
| Immigrants | Yemen | 0.0 /100 | #337 | Tragic 77.9% |
| Immigrants | Guatemala | 0.0 /100 | #338 | Tragic 77.9% |
| Immigrants | El Salvador | 0.0 /100 | #339 | Tragic 77.6% |
| Tohono O'odham | 0.0 /100 | #340 | Tragic 77.5% |
| Mexicans | 0.0 /100 | #341 | Tragic 77.4% |
| Pima | 0.0 /100 | #342 | Tragic 76.4% |
| Immigrants | Central America | 0.0 /100 | #343 | Tragic 76.4% |
| Spanish American Indians | 0.0 /100 | #344 | Tragic 76.3% |
| Immigrants | Mexico | 0.0 /100 | #345 | Tragic 75.7% |
| Houma | 0.0 /100 | #346 | Tragic 75.0% |
| Yakama | 0.0 /100 | #347 | Tragic 74.5% |