Welsh vs Native Hawaiian Median Household Income
COMPARE
Welsh
Native Hawaiian
Median Household Income
Median Household Income Comparison
Welsh
Native Hawaiians
$83,628
MEDIAN HOUSEHOLD INCOME
28.0/ 100
METRIC RATING
192nd/ 347
METRIC RANK
$89,919
MEDIAN HOUSEHOLD INCOME
95.7/ 100
METRIC RATING
116th/ 347
METRIC RANK
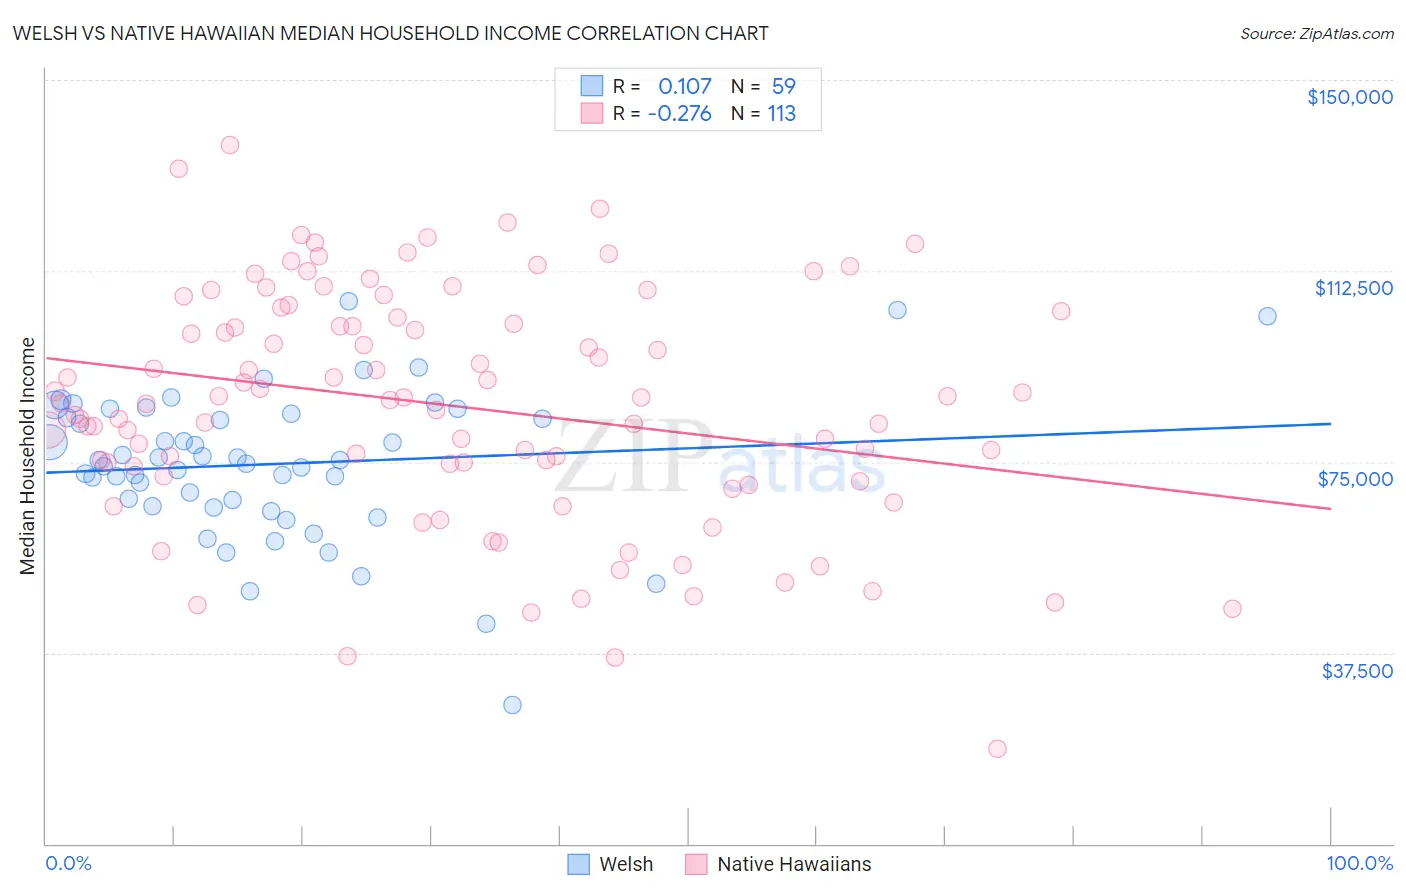
Welsh vs Native Hawaiian Median Household Income Correlation Chart
The statistical analysis conducted on geographies consisting of 527,928,431 people shows a poor positive correlation between the proportion of Welsh and median household income in the United States with a correlation coefficient (R) of 0.107 and weighted average of $83,628. Similarly, the statistical analysis conducted on geographies consisting of 331,802,706 people shows a weak negative correlation between the proportion of Native Hawaiians and median household income in the United States with a correlation coefficient (R) of -0.276 and weighted average of $89,919, a difference of 7.5%.
Median Household Income Correlation Summary
| Measurement | Welsh | Native Hawaiian |
| Minimum | $27,188 | $18,739 |
| Maximum | $106,528 | $137,302 |
| Range | $79,340 | $118,563 |
| Mean | $74,552 | $86,036 |
| Median | $75,263 | $87,089 |
| Interquartile 25% (IQ1) | $66,384 | $73,233 |
| Interquartile 75% (IQ3) | $84,494 | $104,035 |
| Interquartile Range (IQR) | $18,110 | $30,802 |
| Standard Deviation (Sample) | $14,468 | $23,037 |
| Standard Deviation (Population) | $14,345 | $22,935 |
Similar Demographics by Median Household Income
Demographics Similar to Welsh by Median Household Income
In terms of median household income, the demographic groups most similar to Welsh are Finnish ($83,607, a difference of 0.030%), Ghanaian ($83,582, a difference of 0.060%), Immigrants from Armenia ($83,555, a difference of 0.090%), Iraqi ($83,753, a difference of 0.15%), and French ($83,468, a difference of 0.19%).
| Demographics | Rating | Rank | Median Household Income |
| Kenyans | 34.2 /100 | #185 | Fair $84,085 |
| Puget Sound Salish | 33.2 /100 | #186 | Fair $84,011 |
| Belgians | 33.2 /100 | #187 | Fair $84,008 |
| Tlingit-Haida | 32.6 /100 | #188 | Fair $83,968 |
| Immigrants | Colombia | 31.7 /100 | #189 | Fair $83,902 |
| Slovaks | 30.2 /100 | #190 | Fair $83,798 |
| Iraqis | 29.6 /100 | #191 | Fair $83,753 |
| Welsh | 28.0 /100 | #192 | Fair $83,628 |
| Finns | 27.7 /100 | #193 | Fair $83,607 |
| Ghanaians | 27.4 /100 | #194 | Fair $83,582 |
| Immigrants | Armenia | 27.0 /100 | #195 | Fair $83,555 |
| French | 26.0 /100 | #196 | Fair $83,468 |
| Aleuts | 25.7 /100 | #197 | Fair $83,446 |
| Japanese | 25.1 /100 | #198 | Fair $83,395 |
| Germans | 24.6 /100 | #199 | Fair $83,358 |
Demographics Similar to Native Hawaiians by Median Household Income
In terms of median household income, the demographic groups most similar to Native Hawaiians are Taiwanese ($89,900, a difference of 0.020%), Immigrants from Western Asia ($90,005, a difference of 0.10%), Syrian ($89,830, a difference of 0.10%), Immigrants from Northern Africa ($90,026, a difference of 0.12%), and Albanian ($89,744, a difference of 0.20%).
| Demographics | Rating | Rank | Median Household Income |
| Chileans | 97.2 /100 | #109 | Exceptional $90,605 |
| Palestinians | 97.1 /100 | #110 | Exceptional $90,574 |
| Immigrants | Poland | 97.1 /100 | #111 | Exceptional $90,549 |
| Northern Europeans | 96.9 /100 | #112 | Exceptional $90,446 |
| Peruvians | 96.5 /100 | #113 | Exceptional $90,261 |
| Immigrants | Northern Africa | 95.9 /100 | #114 | Exceptional $90,026 |
| Immigrants | Western Asia | 95.9 /100 | #115 | Exceptional $90,005 |
| Native Hawaiians | 95.7 /100 | #116 | Exceptional $89,919 |
| Taiwanese | 95.6 /100 | #117 | Exceptional $89,900 |
| Syrians | 95.4 /100 | #118 | Exceptional $89,830 |
| Albanians | 95.2 /100 | #119 | Exceptional $89,744 |
| Immigrants | North Macedonia | 95.2 /100 | #120 | Exceptional $89,741 |
| Ethiopians | 94.9 /100 | #121 | Exceptional $89,640 |
| Pakistanis | 94.8 /100 | #122 | Exceptional $89,638 |
| Immigrants | Zimbabwe | 94.4 /100 | #123 | Exceptional $89,496 |