Welsh vs Latvian Median Household Income
COMPARE
Welsh
Latvian
Median Household Income
Median Household Income Comparison
Welsh
Latvians
$83,628
MEDIAN HOUSEHOLD INCOME
28.0/ 100
METRIC RATING
192nd/ 347
METRIC RANK
$97,311
MEDIAN HOUSEHOLD INCOME
100.0/ 100
METRIC RATING
37th/ 347
METRIC RANK
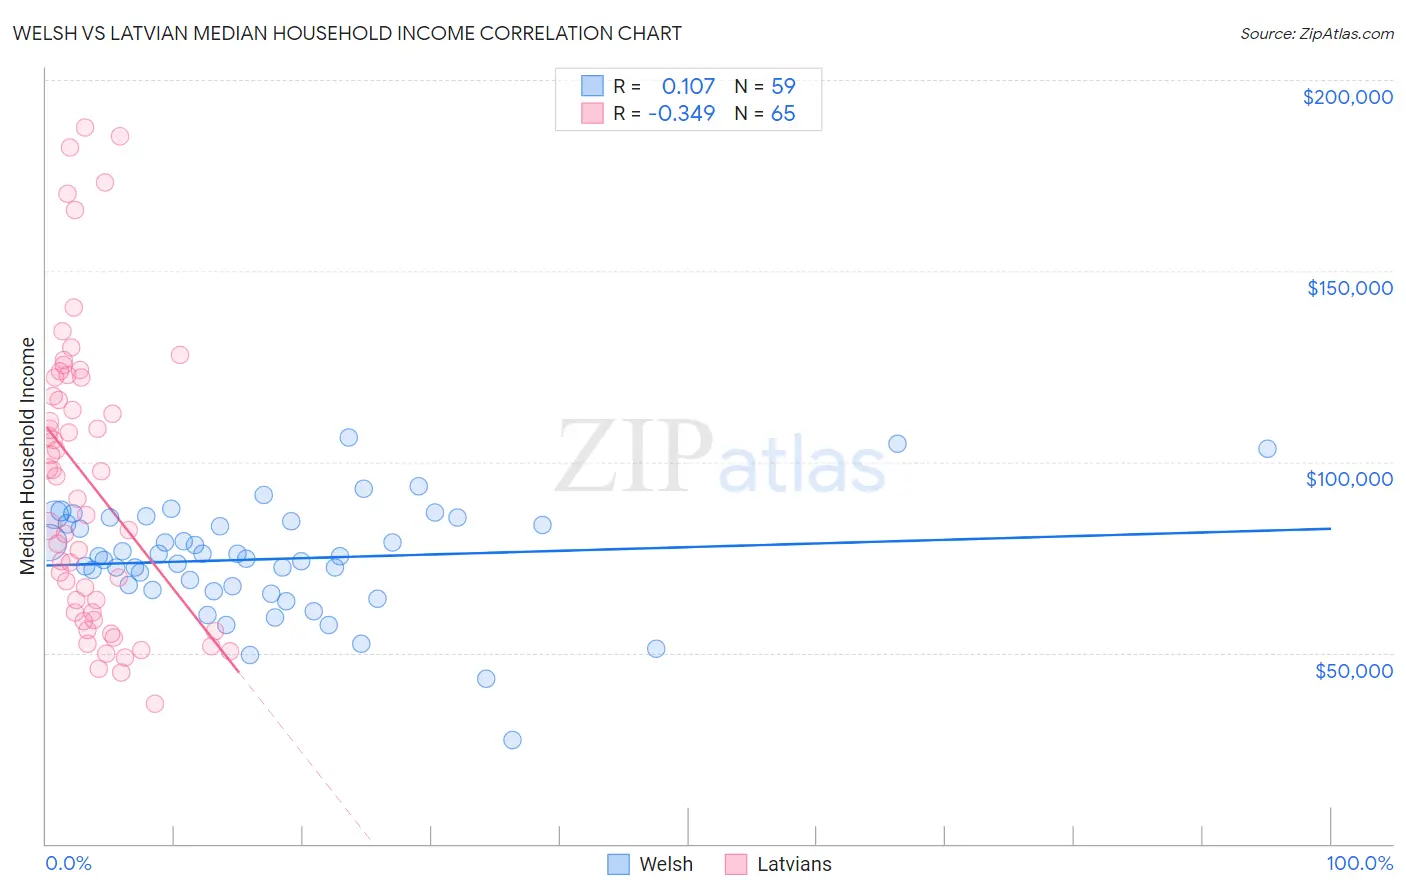
Welsh vs Latvian Median Household Income Correlation Chart
The statistical analysis conducted on geographies consisting of 527,928,431 people shows a poor positive correlation between the proportion of Welsh and median household income in the United States with a correlation coefficient (R) of 0.107 and weighted average of $83,628. Similarly, the statistical analysis conducted on geographies consisting of 220,635,560 people shows a mild negative correlation between the proportion of Latvians and median household income in the United States with a correlation coefficient (R) of -0.349 and weighted average of $97,311, a difference of 16.4%.
Median Household Income Correlation Summary
| Measurement | Welsh | Latvian |
| Minimum | $27,188 | $36,528 |
| Maximum | $106,528 | $187,593 |
| Range | $79,340 | $151,065 |
| Mean | $74,552 | $95,169 |
| Median | $75,263 | $96,299 |
| Interquartile 25% (IQ1) | $66,384 | $60,583 |
| Interquartile 75% (IQ3) | $84,494 | $122,068 |
| Interquartile Range (IQR) | $18,110 | $61,485 |
| Standard Deviation (Sample) | $14,468 | $38,310 |
| Standard Deviation (Population) | $14,345 | $38,014 |
Similar Demographics by Median Household Income
Demographics Similar to Welsh by Median Household Income
In terms of median household income, the demographic groups most similar to Welsh are Finnish ($83,607, a difference of 0.030%), Ghanaian ($83,582, a difference of 0.060%), Immigrants from Armenia ($83,555, a difference of 0.090%), Iraqi ($83,753, a difference of 0.15%), and French ($83,468, a difference of 0.19%).
| Demographics | Rating | Rank | Median Household Income |
| Kenyans | 34.2 /100 | #185 | Fair $84,085 |
| Puget Sound Salish | 33.2 /100 | #186 | Fair $84,011 |
| Belgians | 33.2 /100 | #187 | Fair $84,008 |
| Tlingit-Haida | 32.6 /100 | #188 | Fair $83,968 |
| Immigrants | Colombia | 31.7 /100 | #189 | Fair $83,902 |
| Slovaks | 30.2 /100 | #190 | Fair $83,798 |
| Iraqis | 29.6 /100 | #191 | Fair $83,753 |
| Welsh | 28.0 /100 | #192 | Fair $83,628 |
| Finns | 27.7 /100 | #193 | Fair $83,607 |
| Ghanaians | 27.4 /100 | #194 | Fair $83,582 |
| Immigrants | Armenia | 27.0 /100 | #195 | Fair $83,555 |
| French | 26.0 /100 | #196 | Fair $83,468 |
| Aleuts | 25.7 /100 | #197 | Fair $83,446 |
| Japanese | 25.1 /100 | #198 | Fair $83,395 |
| Germans | 24.6 /100 | #199 | Fair $83,358 |
Demographics Similar to Latvians by Median Household Income
In terms of median household income, the demographic groups most similar to Latvians are Immigrants from Indonesia ($97,297, a difference of 0.010%), Immigrants from Pakistan ($97,528, a difference of 0.22%), Afghan ($97,026, a difference of 0.29%), Maltese ($97,015, a difference of 0.31%), and Immigrants from Turkey ($96,964, a difference of 0.36%).
| Demographics | Rating | Rank | Median Household Income |
| Immigrants | Northern Europe | 100.0 /100 | #30 | Exceptional $99,813 |
| Turks | 100.0 /100 | #31 | Exceptional $99,389 |
| Immigrants | Denmark | 100.0 /100 | #32 | Exceptional $98,510 |
| Chinese | 100.0 /100 | #33 | Exceptional $98,496 |
| Russians | 100.0 /100 | #34 | Exceptional $98,008 |
| Immigrants | Switzerland | 100.0 /100 | #35 | Exceptional $97,979 |
| Immigrants | Pakistan | 100.0 /100 | #36 | Exceptional $97,528 |
| Latvians | 100.0 /100 | #37 | Exceptional $97,311 |
| Immigrants | Indonesia | 100.0 /100 | #38 | Exceptional $97,297 |
| Afghans | 100.0 /100 | #39 | Exceptional $97,026 |
| Maltese | 100.0 /100 | #40 | Exceptional $97,015 |
| Immigrants | Turkey | 100.0 /100 | #41 | Exceptional $96,964 |
| Immigrants | Lithuania | 99.9 /100 | #42 | Exceptional $96,836 |
| Immigrants | France | 99.9 /100 | #43 | Exceptional $96,743 |
| Immigrants | Greece | 99.9 /100 | #44 | Exceptional $96,675 |