Trinidadian and Tobagonian vs Somali In Labor Force | Age 16-19
COMPARE
Trinidadian and Tobagonian
Somali
In Labor Force | Age 16-19
In Labor Force | Age 16-19 Comparison
Trinidadians and Tobagonians
Somalis
30.9%
IN LABOR FORCE | AGE 16-19
0.0/ 100
METRIC RATING
331st/ 347
METRIC RANK
45.1%
IN LABOR FORCE | AGE 16-19
100.0/ 100
METRIC RATING
6th/ 347
METRIC RANK
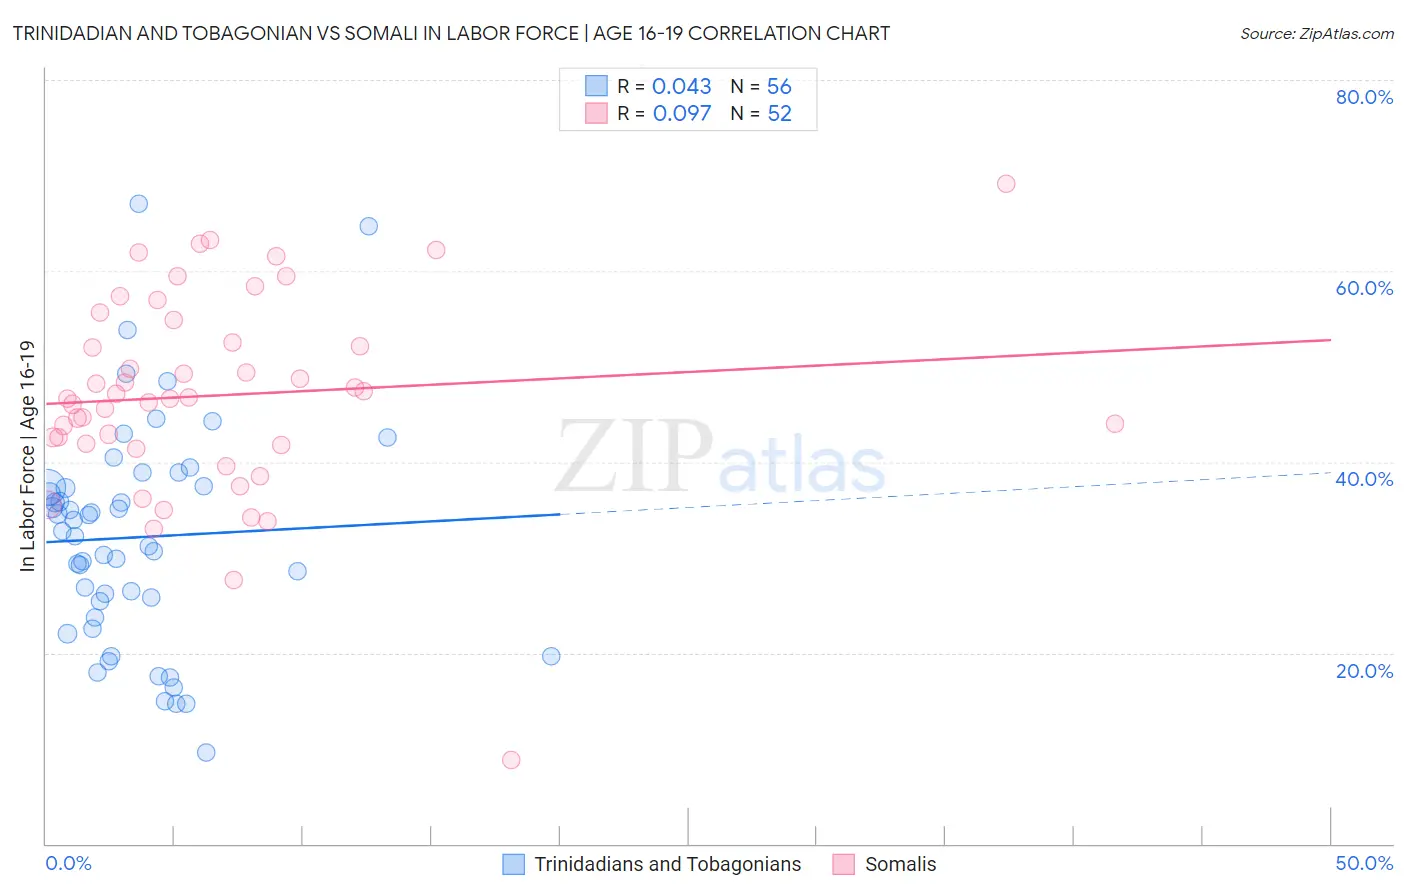
Trinidadian and Tobagonian vs Somali In Labor Force | Age 16-19 Correlation Chart
The statistical analysis conducted on geographies consisting of 219,758,422 people shows no correlation between the proportion of Trinidadians and Tobagonians and labor force participation rate among population between the ages 16 and 19 in the United States with a correlation coefficient (R) of 0.043 and weighted average of 30.9%. Similarly, the statistical analysis conducted on geographies consisting of 99,321,007 people shows a slight positive correlation between the proportion of Somalis and labor force participation rate among population between the ages 16 and 19 in the United States with a correlation coefficient (R) of 0.097 and weighted average of 45.1%, a difference of 45.9%.
In Labor Force | Age 16-19 Correlation Summary
| Measurement | Trinidadian and Tobagonian | Somali |
| Minimum | 9.5% | 8.8% |
| Maximum | 67.1% | 69.1% |
| Range | 57.6% | 60.3% |
| Mean | 32.1% | 47.0% |
| Median | 32.5% | 46.7% |
| Interquartile 25% (IQ1) | 24.6% | 41.8% |
| Interquartile 75% (IQ3) | 37.4% | 53.7% |
| Interquartile Range (IQR) | 12.8% | 11.8% |
| Standard Deviation (Sample) | 11.7% | 10.6% |
| Standard Deviation (Population) | 11.6% | 10.5% |
Similar Demographics by In Labor Force | Age 16-19
Demographics Similar to Trinidadians and Tobagonians by In Labor Force | Age 16-19
In terms of in labor force | age 16-19, the demographic groups most similar to Trinidadians and Tobagonians are Lumbee (31.0%, a difference of 0.15%), Barbadian (31.0%, a difference of 0.27%), Immigrants from Ecuador (31.0%, a difference of 0.30%), Immigrants from Taiwan (31.0%, a difference of 0.34%), and Immigrants from Dominican Republic (31.1%, a difference of 0.50%).
| Demographics | Rating | Rank | In Labor Force | Age 16-19 |
| Dominicans | 0.0 /100 | #324 | Tragic 31.2% |
| Immigrants | China | 0.0 /100 | #325 | Tragic 31.1% |
| Immigrants | Dominican Republic | 0.0 /100 | #326 | Tragic 31.1% |
| Immigrants | Taiwan | 0.0 /100 | #327 | Tragic 31.0% |
| Immigrants | Ecuador | 0.0 /100 | #328 | Tragic 31.0% |
| Barbadians | 0.0 /100 | #329 | Tragic 31.0% |
| Lumbee | 0.0 /100 | #330 | Tragic 31.0% |
| Trinidadians and Tobagonians | 0.0 /100 | #331 | Tragic 30.9% |
| Immigrants | Israel | 0.0 /100 | #332 | Tragic 30.5% |
| Immigrants | Hong Kong | 0.0 /100 | #333 | Tragic 30.5% |
| Puerto Ricans | 0.0 /100 | #334 | Tragic 30.3% |
| Immigrants | Cuba | 0.0 /100 | #335 | Tragic 30.2% |
| Immigrants | Trinidad and Tobago | 0.0 /100 | #336 | Tragic 30.2% |
| Immigrants | Bangladesh | 0.0 /100 | #337 | Tragic 30.0% |
| Vietnamese | 0.0 /100 | #338 | Tragic 29.6% |
Demographics Similar to Somalis by In Labor Force | Age 16-19
In terms of in labor force | age 16-19, the demographic groups most similar to Somalis are Alaskan Athabascan (45.2%, a difference of 0.17%), Luxembourger (45.3%, a difference of 0.36%), Danish (44.7%, a difference of 0.95%), Immigrants from Cabo Verde (44.7%, a difference of 0.99%), and Immigrants from Somalia (45.6%, a difference of 1.0%).
| Demographics | Rating | Rank | In Labor Force | Age 16-19 |
| Pennsylvania Germans | 100.0 /100 | #1 | Exceptional 46.4% |
| Norwegians | 100.0 /100 | #2 | Exceptional 46.2% |
| Immigrants | Somalia | 100.0 /100 | #3 | Exceptional 45.6% |
| Luxembourgers | 100.0 /100 | #4 | Exceptional 45.3% |
| Alaskan Athabascans | 100.0 /100 | #5 | Exceptional 45.2% |
| Somalis | 100.0 /100 | #6 | Exceptional 45.1% |
| Danes | 100.0 /100 | #7 | Exceptional 44.7% |
| Immigrants | Cabo Verde | 100.0 /100 | #8 | Exceptional 44.7% |
| Cape Verdeans | 100.0 /100 | #9 | Exceptional 44.5% |
| Germans | 100.0 /100 | #10 | Exceptional 44.2% |
| Swedes | 100.0 /100 | #11 | Exceptional 44.1% |
| Finns | 100.0 /100 | #12 | Exceptional 43.9% |
| Dutch | 100.0 /100 | #13 | Exceptional 43.8% |
| Chippewa | 100.0 /100 | #14 | Exceptional 43.8% |
| Slovenes | 100.0 /100 | #15 | Exceptional 43.7% |