Tlingit-Haida vs Israeli Householder Income Over 65 years

COMPARE

Tlingit-Haida
Race
Ancestry
AfghanAfricanAlaska NativeAlaskan AthabascanAlbanianAleutAlsatianAmericanApacheArabArapahoArgentineanArmenianAssyrian/Chaldean/SyriacAustralianAustrianBahamianBangladeshiBarbadianBasqueBelgianBelizeanBermudanBhutaneseBlackfeetBolivianBrazilianBritishBritish West IndianBulgarianBurmeseCajunCambodianCanadianCape VerdeanCarpatho RusynCelticCentral AmericanCentral American IndianCherokeeCheyenneChickasawChileanChineseChippewaChoctawColombianColvilleComancheCosta RicanCreeCreekCroatianCrowCubanCypriotCzechCzechoslovakianDanishDelawareDominicanDutchDutch West IndianEastern EuropeanEcuadorianEgyptianEnglishEstonianEthiopianEuropeanFijianFilipinoFinnishFrenchFrench American IndianFrench CanadianGermanGerman RussianGhanaianGreekGuamanian/ChamorroGuatemalanGuyaneseHaitianHmongHonduranHopiHoumaHungarianIcelanderIndian (Asian)IndonesianInupiatIranianIraqiIrishIroquoisItalianJamaicanJapaneseJordanianKenyanKiowaKoreanLaotianLatvianLebaneseLiberianLithuanianLumbeeLuxembourgerMacedonianMalaysianMalteseMarshalleseMenomineeMexicanMexican American IndianMongolianMoroccanNative HawaiianNavajoNepaleseNew ZealanderNicaraguanNigerianNorthern EuropeanNorwegianOkinawanOsageOttawaPaiutePakistaniPalestinianPanamanianParaguayanPennsylvania GermanPeruvianPimaPolishPortuguesePotawatomiPuebloPuerto RicanPuget Sound SalishRomanianRussianSalvadoranSamoanScandinavianScotch-IrishScottishSeminoleSenegaleseSerbianShoshoneSierra LeoneanSiouxSlavicSlovakSloveneSomaliSouth AfricanSouth AmericanSouth American IndianSoviet UnionSpaniardSpanishSpanish AmericanSpanish American IndianSri LankanSubsaharan AfricanSudaneseSwedishSwissSyrianTaiwaneseThaiTlingit-HaidaTohono O'OdhamTonganTrinidadian and TobagonianTsimshianTurkishU.S. Virgin IslanderUgandanUkrainianUruguayanUteVenezuelanVietnameseWelshWest IndianYakamaYaquiYugoslavianYumanYup'ikZimbabwean
Immigration
NonimmigrantsImmigrantsAfghanistanAfricaAlbaniaArgentinaArmeniaAsiaAustraliaAustriaBahamasBangladeshBarbadosBelarusBelgiumBelizeBoliviaBosnia and HerzegovinaBrazilBulgariaBurma/MyanmarCabo VerdeCambodiaCameroonCanadaCaribbeanCentral AmericaChileChinaColombiaCongoCosta RicaCroatiaCubaCzechoslovakiaDenmarkDominicaDominican RepublicEastern AfricaEastern AsiaEastern EuropeEcuadorEgyptEl SalvadorEnglandEritreaEthiopiaEuropeFijiFranceGermanyGhanaGreeceGrenadaGuatemalaGuyanaHaitiHondurasHong KongHungaryIndiaIndonesiaIranIraqIrelandIsraelItalyJamaicaJapanJordanKazakhstanKenyaKoreaKuwaitLaosLatin AmericaLatviaLebanonLiberiaLithuaniaMalaysiaMexicoMicronesiaMiddle AfricaMoldovaMoroccoNepalNetherlandsNicaraguaNigeriaNorth AmericaNorth MacedoniaNorthern AfricaNorthern EuropeNorwayOceaniaPakistanPanamaPeruPhilippinesPolandPortugalRomaniaRussiaSaudi ArabiaScotlandSenegalSerbiaSierra LeoneSingaporeSomaliaSouth AfricaSouth AmericaSouth Central AsiaSouth Eastern AsiaSouthern EuropeSpainSri LankaSt. Vincent and the GrenadinesSudanSwedenSwitzerlandSyriaTaiwanThailandTrinidad and TobagoTurkeyUgandaUkraineUruguayUzbekistanVenezuelaVietnamWest IndiesWestern AfricaWestern AsiaWestern EuropeYemenZaireZimbabweAzores
Israeli
Race
Ancestry
AfghanAfricanAlaska NativeAlaskan AthabascanAlbanianAleutAlsatianAmericanApacheArabArapahoArgentineanArmenianAssyrian/Chaldean/SyriacAustralianAustrianBahamianBangladeshiBarbadianBasqueBelgianBelizeanBermudanBhutaneseBlackfeetBolivianBrazilianBritishBritish West IndianBulgarianBurmeseCajunCambodianCanadianCape VerdeanCarpatho RusynCelticCentral AmericanCentral American IndianCherokeeCheyenneChickasawChileanChineseChippewaChoctawColombianColvilleComancheCosta RicanCreeCreekCroatianCrowCubanCypriotCzechCzechoslovakianDanishDelawareDominicanDutchDutch West IndianEastern EuropeanEcuadorianEgyptianEnglishEstonianEthiopianEuropeanFijianFilipinoFinnishFrenchFrench American IndianFrench CanadianGermanGerman RussianGhanaianGreekGuamanian/ChamorroGuatemalanGuyaneseHaitianHmongHonduranHopiHoumaHungarianIcelanderIndian (Asian)IndonesianInupiatIranianIraqiIrishIroquoisIsraeliItalianJamaicanJapaneseJordanianKenyanKiowaKoreanLaotianLatvianLebaneseLiberianLithuanianLumbeeLuxembourgerMacedonianMalaysianMalteseMarshalleseMenomineeMexicanMexican American IndianMongolianMoroccanNative HawaiianNavajoNepaleseNew ZealanderNicaraguanNigerianNorthern EuropeanNorwegianOkinawanOsageOttawaPaiutePakistaniPalestinianPanamanianParaguayanPennsylvania GermanPeruvianPimaPolishPortuguesePotawatomiPuebloPuerto RicanPuget Sound SalishRomanianRussianSalvadoranSamoanScandinavianScotch-IrishScottishSeminoleSenegaleseSerbianShoshoneSierra LeoneanSiouxSlavicSlovakSloveneSomaliSouth AfricanSouth AmericanSouth American IndianSoviet UnionSpaniardSpanishSpanish AmericanSpanish American IndianSri LankanSubsaharan AfricanSudaneseSwedishSwissSyrianTaiwaneseThaiTohono O'OdhamTonganTrinidadian and TobagonianTsimshianTurkishU.S. Virgin IslanderUgandanUkrainianUruguayanUteVenezuelanVietnameseWelshWest IndianYakamaYaquiYugoslavianYumanYup'ikZimbabwean
Immigration
NonimmigrantsImmigrantsAfghanistanAfricaAlbaniaArgentinaArmeniaAsiaAustraliaAustriaBahamasBangladeshBarbadosBelarusBelgiumBelizeBoliviaBosnia and HerzegovinaBrazilBulgariaBurma/MyanmarCabo VerdeCambodiaCameroonCanadaCaribbeanCentral AmericaChileChinaColombiaCongoCosta RicaCroatiaCubaCzechoslovakiaDenmarkDominicaDominican RepublicEastern AfricaEastern AsiaEastern EuropeEcuadorEgyptEl SalvadorEnglandEritreaEthiopiaEuropeFijiFranceGermanyGhanaGreeceGrenadaGuatemalaGuyanaHaitiHondurasHong KongHungaryIndiaIndonesiaIranIraqIrelandIsraelItalyJamaicaJapanJordanKazakhstanKenyaKoreaKuwaitLaosLatin AmericaLatviaLebanonLiberiaLithuaniaMalaysiaMexicoMicronesiaMiddle AfricaMoldovaMoroccoNepalNetherlandsNicaraguaNigeriaNorth AmericaNorth MacedoniaNorthern AfricaNorthern EuropeNorwayOceaniaPakistanPanamaPeruPhilippinesPolandPortugalRomaniaRussiaSaudi ArabiaScotlandSenegalSerbiaSierra LeoneSingaporeSomaliaSouth AfricaSouth AmericaSouth Central AsiaSouth Eastern AsiaSouthern EuropeSpainSri LankaSt. Vincent and the GrenadinesSudanSwedenSwitzerlandSyriaTaiwanThailandTrinidad and TobagoTurkeyUgandaUkraineUruguayUzbekistanVenezuelaVietnamWest IndiesWestern AfricaWestern AsiaWestern EuropeYemenZaireZimbabweAzores
Householder Income Over 65 years
Income
Poverty
Unemployment
Labor Participation
Family Structure
Vehicle Availability
Education Level
Disability

Householder Income Over 65 years Comparison

Tlingit-Haida

Israelis

Excellent
Exceptional
$62,922
HOUSEHOLDER INCOME OVER 65 YEARS
88.6/ 100
METRIC RATING
123rd/ 347
METRIC RANK
$66,636
HOUSEHOLDER INCOME OVER 65 YEARS
99.7/ 100
METRIC RATING
51st/ 347
METRIC RANK

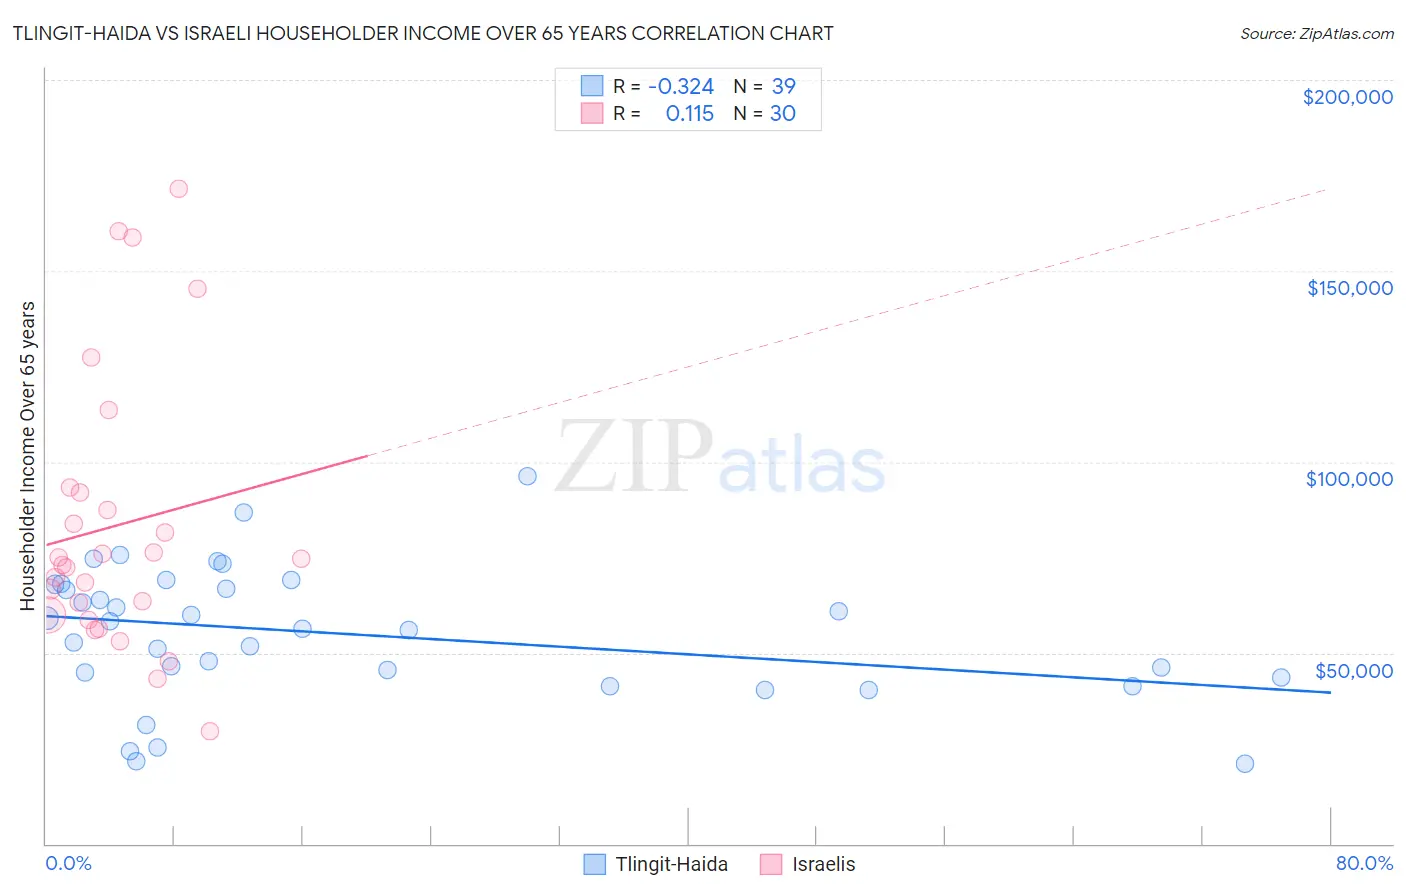
Tlingit-Haida vs Israeli Householder Income Over 65 years Correlation Chart

The statistical analysis conducted on geographies consisting of 60,750,081 people shows a mild negative correlation between the proportion of Tlingit-Haida and household income with householder over the age of 65 in the United States with a correlation coefficient (R) of -0.324 and weighted average of $62,922. Similarly, the statistical analysis conducted on geographies consisting of 210,595,359 people shows a poor positive correlation between the proportion of Israelis and household income with householder over the age of 65 in the United States with a correlation coefficient (R) of 0.115 and weighted average of $66,636, a difference of 5.9%.
Tlingit-Haida vs Israeli Householder Income Over 65 years

Householder Income Over 65 years Correlation Summary

MeasurementTlingit-HaidaIsraeli
Minimum$20,833$29,457
Maximum$96,250$171,563
Range$75,417$142,106
Mean$54,963$83,272
Median$56,173$73,731
Interquartile 25% (IQ1)$43,571$59,859
Interquartile 75% (IQ3)$67,937$92,033
Interquartile Range (IQR)$24,366$32,174
Standard Deviation (Sample)$17,428$36,038
Standard Deviation (Population)$17,203$35,432

Similar Demographics by Householder Income Over 65 years

Demographics Similar to Tlingit-Haida by Householder Income Over 65 years

In terms of householder income over 65 years, the demographic groups most similar to Tlingit-Haida are Immigrants from Moldova ($62,939, a difference of 0.030%), Taiwanese ($62,894, a difference of 0.040%), Soviet Union ($62,848, a difference of 0.12%), Immigrants from Vietnam ($63,014, a difference of 0.15%), and Ukrainian ($63,032, a difference of 0.18%).
DemographicsRating | RankHouseholder Income Over 65 years
Guamanians/Chamorros
91.1
/100
|
#116
Exceptional
$63,187
Immigrants | Croatia
90.9
/100
|
#117
Exceptional
$63,168
Danes
90.5
/100
|
#118
Exceptional
$63,117
Immigrants | Jordan
89.8
/100
|
#119
Excellent
$63,041
Ukrainians
89.7
/100
|
#120
Excellent
$63,032
Immigrants | Vietnam
89.5
/100
|
#121
Excellent
$63,014
Immigrants | Moldova
88.7
/100
|
#122
Excellent
$62,939
Tlingit-Haida
88.6
/100
|
#123
Excellent
$62,922
Taiwanese
88.3
/100
|
#124
Excellent
$62,894
Soviet Union
87.8
/100
|
#125
Excellent
$62,848
Peruvians
86.8
/100
|
#126
Excellent
$62,766
Swedes
86.4
/100
|
#127
Excellent
$62,736
Aleuts
86.1
/100
|
#128
Excellent
$62,708
Immigrants | Eastern Europe
85.9
/100
|
#129
Excellent
$62,693
Basques
85.4
/100
|
#130
Excellent
$62,653

Demographics Similar to Israelis by Householder Income Over 65 years

In terms of householder income over 65 years, the demographic groups most similar to Israelis are Immigrants from Scotland ($66,620, a difference of 0.020%), Immigrants from Pakistan ($66,617, a difference of 0.030%), Immigrants from Turkey ($66,672, a difference of 0.050%), Immigrants from Indonesia ($66,694, a difference of 0.090%), and Immigrants from Netherlands ($66,463, a difference of 0.26%).
DemographicsRating | RankHouseholder Income Over 65 years
Immigrants | South Africa
99.9
/100
|
#44
Exceptional
$67,234
Immigrants | Afghanistan
99.8
/100
|
#45
Exceptional
$67,007
Cambodians
99.8
/100
|
#46
Exceptional
$66,892
Australians
99.8
/100
|
#47
Exceptional
$66,891
Immigrants | France
99.8
/100
|
#48
Exceptional
$66,826
Immigrants | Indonesia
99.8
/100
|
#49
Exceptional
$66,694
Immigrants | Turkey
99.7
/100
|
#50
Exceptional
$66,672
Israelis
99.7
/100
|
#51
Exceptional
$66,636
Immigrants | Scotland
99.7
/100
|
#52
Exceptional
$66,620
Immigrants | Pakistan
99.7
/100
|
#53
Exceptional
$66,617
Immigrants | Netherlands
99.7
/100
|
#54
Exceptional
$66,463
Immigrants | Czechoslovakia
99.7
/100
|
#55
Exceptional
$66,376
Laotians
99.6
/100
|
#56
Exceptional
$66,306
Bulgarians
99.6
/100
|
#57
Exceptional
$66,236
Immigrants | Philippines
99.6
/100
|
#58
Exceptional
$66,161