Tlingit-Haida vs Potawatomi Householder Income Over 65 years
COMPARE
Tlingit-Haida
Potawatomi
Householder Income Over 65 years
Householder Income Over 65 years Comparison
Tlingit-Haida
Potawatomi
$62,922
HOUSEHOLDER INCOME OVER 65 YEARS
88.6/ 100
METRIC RATING
123rd/ 347
METRIC RANK
$54,212
HOUSEHOLDER INCOME OVER 65 YEARS
0.1/ 100
METRIC RATING
272nd/ 347
METRIC RANK
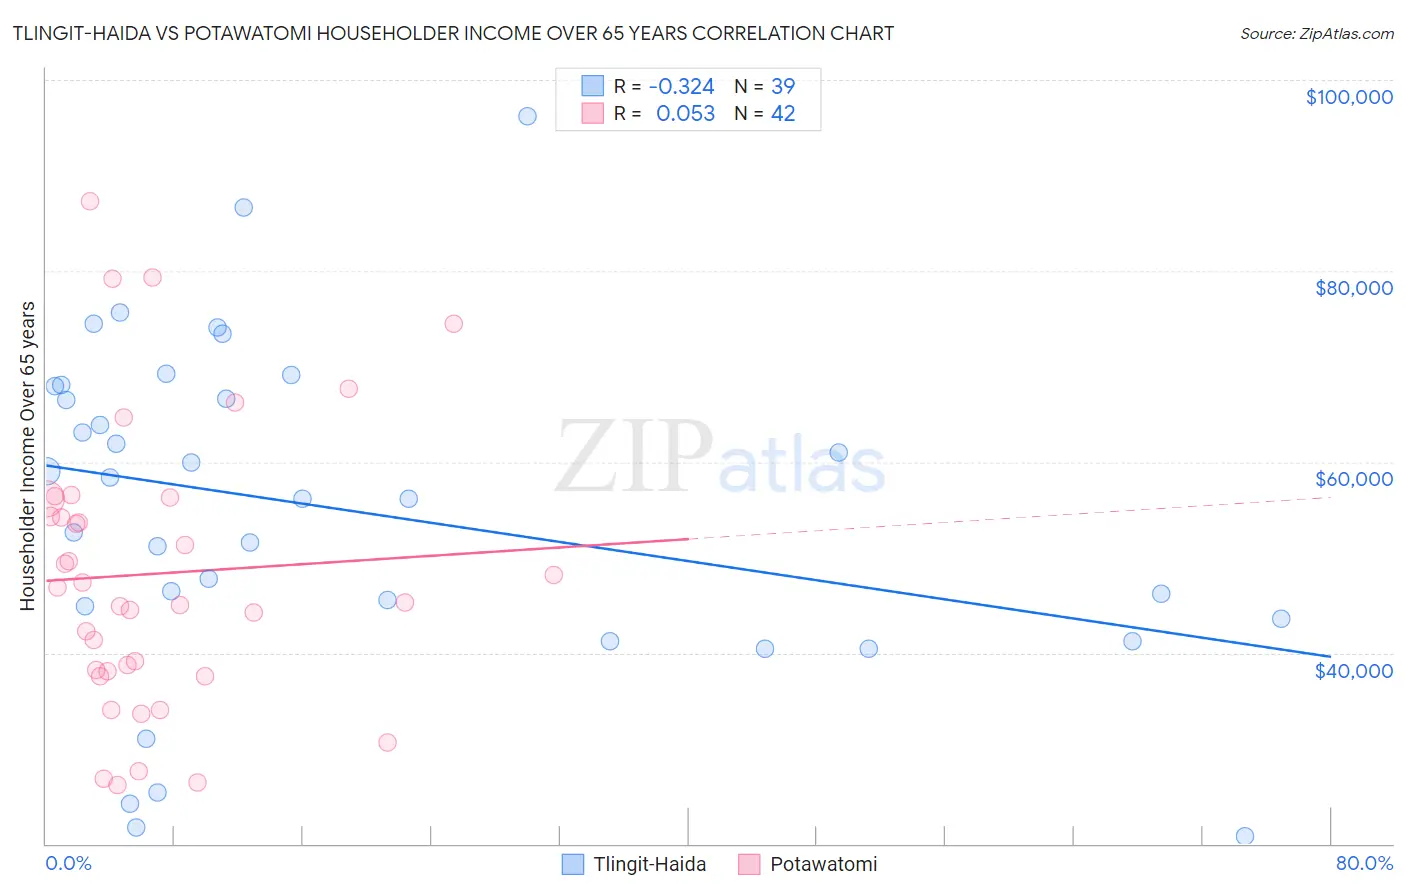
Tlingit-Haida vs Potawatomi Householder Income Over 65 years Correlation Chart
The statistical analysis conducted on geographies consisting of 60,750,081 people shows a mild negative correlation between the proportion of Tlingit-Haida and household income with householder over the age of 65 in the United States with a correlation coefficient (R) of -0.324 and weighted average of $62,922. Similarly, the statistical analysis conducted on geographies consisting of 117,629,291 people shows a slight positive correlation between the proportion of Potawatomi and household income with householder over the age of 65 in the United States with a correlation coefficient (R) of 0.053 and weighted average of $54,212, a difference of 16.1%.
Householder Income Over 65 years Correlation Summary
| Measurement | Tlingit-Haida | Potawatomi |
| Minimum | $20,833 | $26,199 |
| Maximum | $96,250 | $87,267 |
| Range | $75,417 | $61,068 |
| Mean | $54,963 | $48,291 |
| Median | $56,173 | $46,067 |
| Interquartile 25% (IQ1) | $43,571 | $38,035 |
| Interquartile 75% (IQ3) | $67,937 | $56,092 |
| Interquartile Range (IQR) | $24,366 | $18,057 |
| Standard Deviation (Sample) | $17,428 | $14,849 |
| Standard Deviation (Population) | $17,203 | $14,671 |
Similar Demographics by Householder Income Over 65 years
Demographics Similar to Tlingit-Haida by Householder Income Over 65 years
In terms of householder income over 65 years, the demographic groups most similar to Tlingit-Haida are Immigrants from Moldova ($62,939, a difference of 0.030%), Taiwanese ($62,894, a difference of 0.040%), Soviet Union ($62,848, a difference of 0.12%), Immigrants from Vietnam ($63,014, a difference of 0.15%), and Ukrainian ($63,032, a difference of 0.18%).
| Demographics | Rating | Rank | Householder Income Over 65 years |
| Guamanians/Chamorros | 91.1 /100 | #116 | Exceptional $63,187 |
| Immigrants | Croatia | 90.9 /100 | #117 | Exceptional $63,168 |
| Danes | 90.5 /100 | #118 | Exceptional $63,117 |
| Immigrants | Jordan | 89.8 /100 | #119 | Excellent $63,041 |
| Ukrainians | 89.7 /100 | #120 | Excellent $63,032 |
| Immigrants | Vietnam | 89.5 /100 | #121 | Excellent $63,014 |
| Immigrants | Moldova | 88.7 /100 | #122 | Excellent $62,939 |
| Tlingit-Haida | 88.6 /100 | #123 | Excellent $62,922 |
| Taiwanese | 88.3 /100 | #124 | Excellent $62,894 |
| Soviet Union | 87.8 /100 | #125 | Excellent $62,848 |
| Peruvians | 86.8 /100 | #126 | Excellent $62,766 |
| Swedes | 86.4 /100 | #127 | Excellent $62,736 |
| Aleuts | 86.1 /100 | #128 | Excellent $62,708 |
| Immigrants | Eastern Europe | 85.9 /100 | #129 | Excellent $62,693 |
| Basques | 85.4 /100 | #130 | Excellent $62,653 |
Demographics Similar to Potawatomi by Householder Income Over 65 years
In terms of householder income over 65 years, the demographic groups most similar to Potawatomi are Indonesian ($54,176, a difference of 0.070%), Barbadian ($54,163, a difference of 0.090%), Cherokee ($54,133, a difference of 0.15%), Cree ($54,129, a difference of 0.15%), and Cheyenne ($54,096, a difference of 0.21%).
| Demographics | Rating | Rank | Householder Income Over 65 years |
| Belizeans | 0.1 /100 | #265 | Tragic $54,580 |
| Jamaicans | 0.1 /100 | #266 | Tragic $54,560 |
| Guatemalans | 0.1 /100 | #267 | Tragic $54,526 |
| Immigrants | Zaire | 0.1 /100 | #268 | Tragic $54,512 |
| Nicaraguans | 0.1 /100 | #269 | Tragic $54,474 |
| Immigrants | Senegal | 0.1 /100 | #270 | Tragic $54,447 |
| Liberians | 0.1 /100 | #271 | Tragic $54,356 |
| Potawatomi | 0.1 /100 | #272 | Tragic $54,212 |
| Indonesians | 0.1 /100 | #273 | Tragic $54,176 |
| Barbadians | 0.1 /100 | #274 | Tragic $54,163 |
| Cherokee | 0.1 /100 | #275 | Tragic $54,133 |
| Cree | 0.1 /100 | #276 | Tragic $54,129 |
| Cheyenne | 0.1 /100 | #277 | Tragic $54,096 |
| Immigrants | Ecuador | 0.1 /100 | #278 | Tragic $54,030 |
| Blackfeet | 0.1 /100 | #279 | Tragic $54,029 |