Tlingit-Haida vs Mexican Householder Income Over 65 years
COMPARE
Tlingit-Haida
Mexican
Householder Income Over 65 years
Householder Income Over 65 years Comparison
Tlingit-Haida
Mexicans
$62,922
HOUSEHOLDER INCOME OVER 65 YEARS
88.6/ 100
METRIC RATING
123rd/ 347
METRIC RANK
$53,897
HOUSEHOLDER INCOME OVER 65 YEARS
0.1/ 100
METRIC RATING
285th/ 347
METRIC RANK
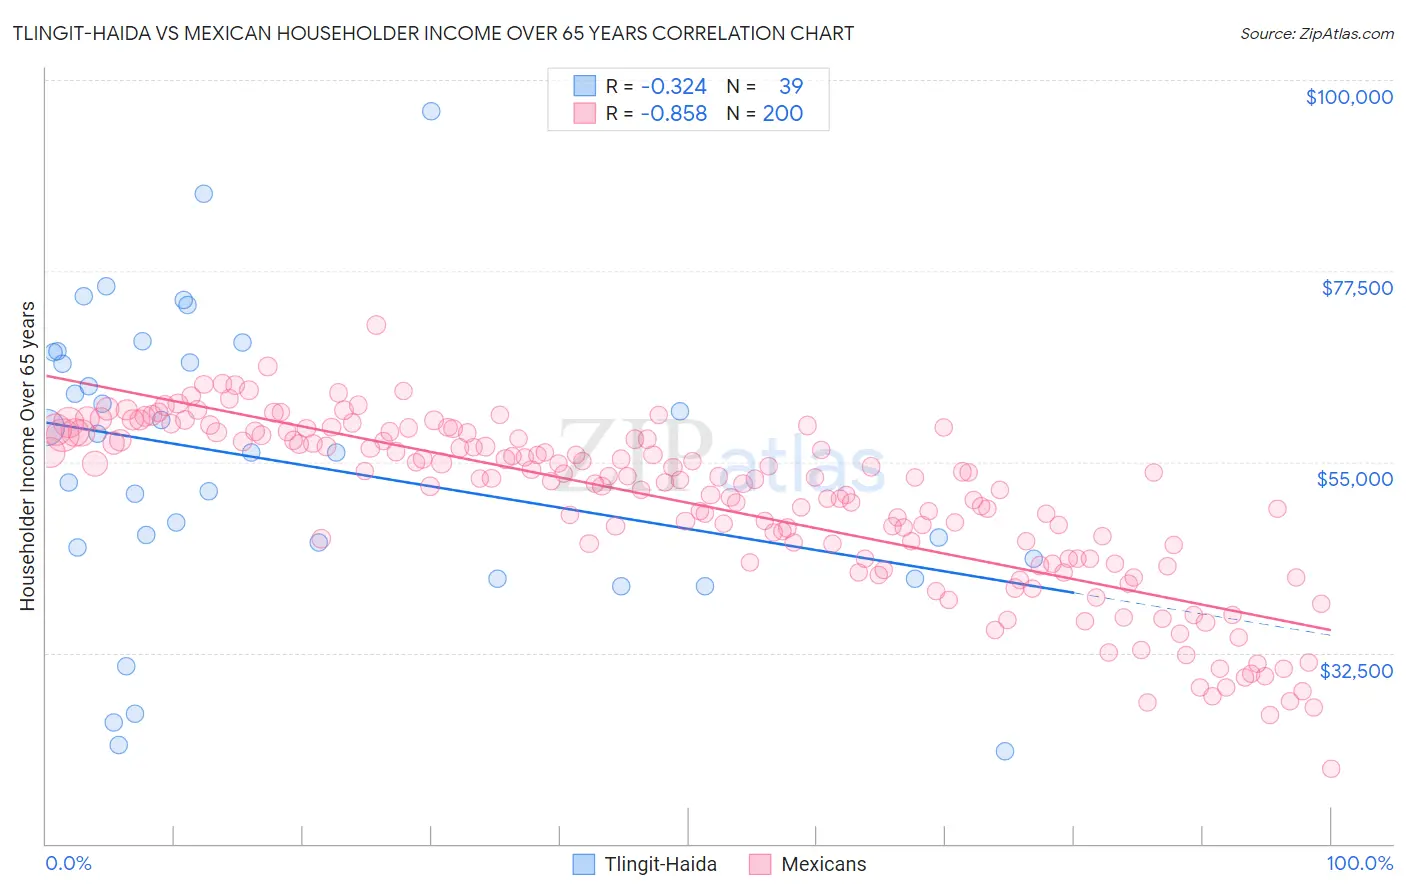
Tlingit-Haida vs Mexican Householder Income Over 65 years Correlation Chart
The statistical analysis conducted on geographies consisting of 60,750,081 people shows a mild negative correlation between the proportion of Tlingit-Haida and household income with householder over the age of 65 in the United States with a correlation coefficient (R) of -0.324 and weighted average of $62,922. Similarly, the statistical analysis conducted on geographies consisting of 559,960,320 people shows a very strong negative correlation between the proportion of Mexicans and household income with householder over the age of 65 in the United States with a correlation coefficient (R) of -0.858 and weighted average of $53,897, a difference of 16.7%.
Householder Income Over 65 years Correlation Summary
| Measurement | Tlingit-Haida | Mexican |
| Minimum | $20,833 | $18,818 |
| Maximum | $96,250 | $71,178 |
| Range | $75,417 | $52,360 |
| Mean | $54,963 | $50,150 |
| Median | $56,173 | $52,997 |
| Interquartile 25% (IQ1) | $43,571 | $43,543 |
| Interquartile 75% (IQ3) | $67,937 | $58,155 |
| Interquartile Range (IQR) | $24,366 | $14,612 |
| Standard Deviation (Sample) | $17,428 | $10,117 |
| Standard Deviation (Population) | $17,203 | $10,091 |
Similar Demographics by Householder Income Over 65 years
Demographics Similar to Tlingit-Haida by Householder Income Over 65 years
In terms of householder income over 65 years, the demographic groups most similar to Tlingit-Haida are Immigrants from Moldova ($62,939, a difference of 0.030%), Taiwanese ($62,894, a difference of 0.040%), Soviet Union ($62,848, a difference of 0.12%), Immigrants from Vietnam ($63,014, a difference of 0.15%), and Ukrainian ($63,032, a difference of 0.18%).
| Demographics | Rating | Rank | Householder Income Over 65 years |
| Guamanians/Chamorros | 91.1 /100 | #116 | Exceptional $63,187 |
| Immigrants | Croatia | 90.9 /100 | #117 | Exceptional $63,168 |
| Danes | 90.5 /100 | #118 | Exceptional $63,117 |
| Immigrants | Jordan | 89.8 /100 | #119 | Excellent $63,041 |
| Ukrainians | 89.7 /100 | #120 | Excellent $63,032 |
| Immigrants | Vietnam | 89.5 /100 | #121 | Excellent $63,014 |
| Immigrants | Moldova | 88.7 /100 | #122 | Excellent $62,939 |
| Tlingit-Haida | 88.6 /100 | #123 | Excellent $62,922 |
| Taiwanese | 88.3 /100 | #124 | Excellent $62,894 |
| Soviet Union | 87.8 /100 | #125 | Excellent $62,848 |
| Peruvians | 86.8 /100 | #126 | Excellent $62,766 |
| Swedes | 86.4 /100 | #127 | Excellent $62,736 |
| Aleuts | 86.1 /100 | #128 | Excellent $62,708 |
| Immigrants | Eastern Europe | 85.9 /100 | #129 | Excellent $62,693 |
| Basques | 85.4 /100 | #130 | Excellent $62,653 |
Demographics Similar to Mexicans by Householder Income Over 65 years
In terms of householder income over 65 years, the demographic groups most similar to Mexicans are Chippewa ($53,847, a difference of 0.090%), Immigrants from Guatemala ($53,950, a difference of 0.10%), Immigrants from Liberia ($53,967, a difference of 0.13%), Immigrants from Armenia ($53,974, a difference of 0.14%), and Somali ($54,004, a difference of 0.20%).
| Demographics | Rating | Rank | Householder Income Over 65 years |
| Immigrants | Ecuador | 0.1 /100 | #278 | Tragic $54,030 |
| Blackfeet | 0.1 /100 | #279 | Tragic $54,029 |
| Immigrants | Jamaica | 0.1 /100 | #280 | Tragic $54,027 |
| Somalis | 0.1 /100 | #281 | Tragic $54,004 |
| Immigrants | Armenia | 0.1 /100 | #282 | Tragic $53,974 |
| Immigrants | Liberia | 0.1 /100 | #283 | Tragic $53,967 |
| Immigrants | Guatemala | 0.1 /100 | #284 | Tragic $53,950 |
| Mexicans | 0.1 /100 | #285 | Tragic $53,897 |
| Chippewa | 0.1 /100 | #286 | Tragic $53,847 |
| Immigrants | Barbados | 0.1 /100 | #287 | Tragic $53,766 |
| Paiute | 0.1 /100 | #288 | Tragic $53,762 |
| Iroquois | 0.1 /100 | #289 | Tragic $53,737 |
| Chickasaw | 0.1 /100 | #290 | Tragic $53,732 |
| Africans | 0.0 /100 | #291 | Tragic $53,711 |
| Shoshone | 0.0 /100 | #292 | Tragic $53,681 |