Trinidadian and Tobagonian vs Israeli Householder Income Over 65 years
COMPARE
Trinidadian and Tobagonian
Israeli
Householder Income Over 65 years
Householder Income Over 65 years Comparison
Trinidadians and Tobagonians
Israelis
$55,327
HOUSEHOLDER INCOME OVER 65 YEARS
0.3/ 100
METRIC RATING
257th/ 347
METRIC RANK
$66,636
HOUSEHOLDER INCOME OVER 65 YEARS
99.7/ 100
METRIC RATING
51st/ 347
METRIC RANK
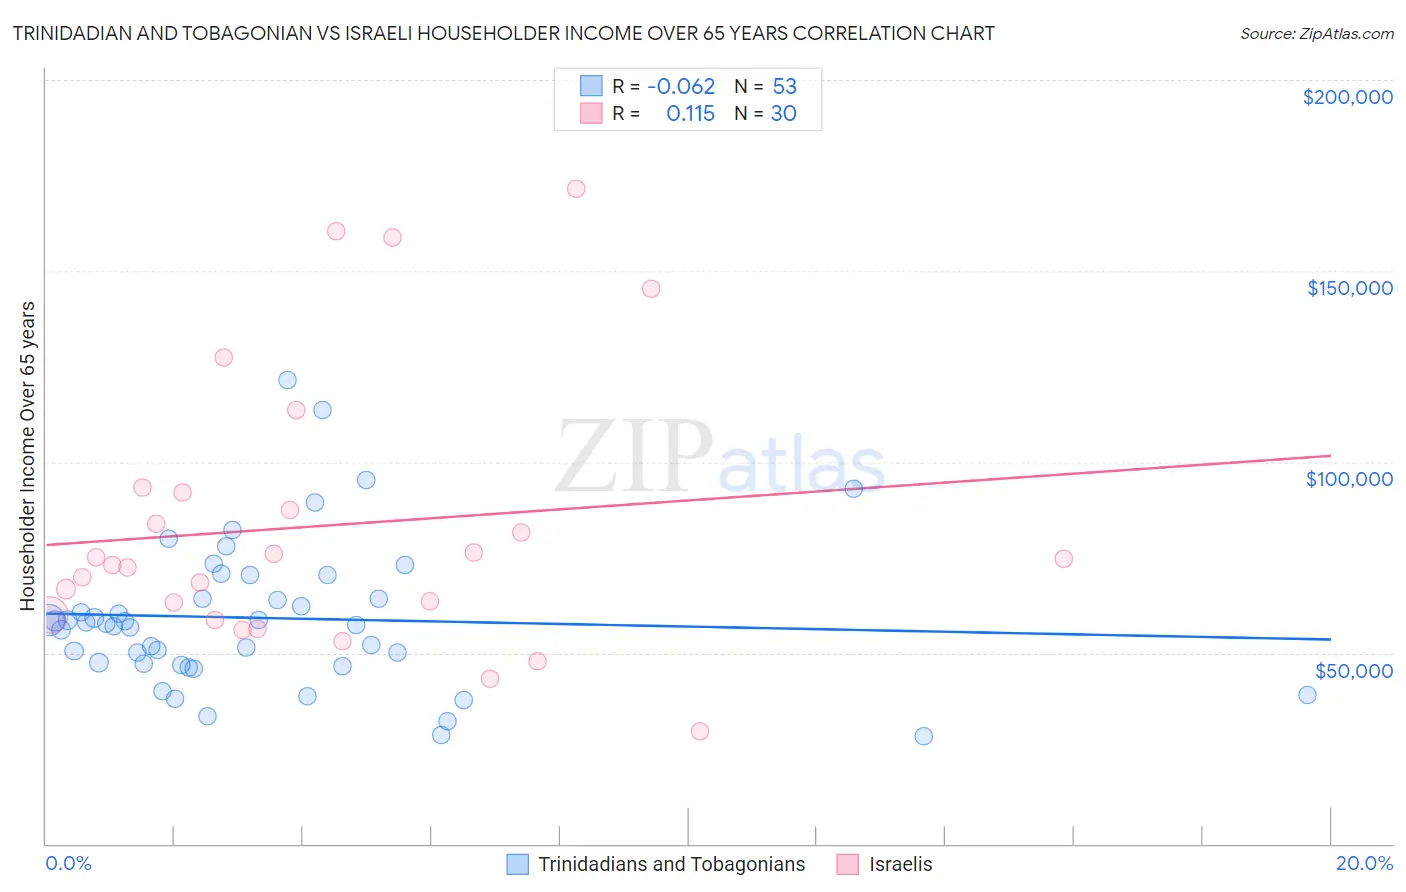
Trinidadian and Tobagonian vs Israeli Householder Income Over 65 years Correlation Chart
The statistical analysis conducted on geographies consisting of 219,266,314 people shows a slight negative correlation between the proportion of Trinidadians and Tobagonians and household income with householder over the age of 65 in the United States with a correlation coefficient (R) of -0.062 and weighted average of $55,327. Similarly, the statistical analysis conducted on geographies consisting of 210,595,359 people shows a poor positive correlation between the proportion of Israelis and household income with householder over the age of 65 in the United States with a correlation coefficient (R) of 0.115 and weighted average of $66,636, a difference of 20.4%.
Householder Income Over 65 years Correlation Summary
| Measurement | Trinidadian and Tobagonian | Israeli |
| Minimum | $28,152 | $29,457 |
| Maximum | $121,597 | $171,563 |
| Range | $93,445 | $142,106 |
| Mean | $59,094 | $83,272 |
| Median | $57,745 | $73,731 |
| Interquartile 25% (IQ1) | $46,990 | $59,859 |
| Interquartile 75% (IQ3) | $67,305 | $92,033 |
| Interquartile Range (IQR) | $20,315 | $32,174 |
| Standard Deviation (Sample) | $19,236 | $36,038 |
| Standard Deviation (Population) | $19,054 | $35,432 |
Similar Demographics by Householder Income Over 65 years
Demographics Similar to Trinidadians and Tobagonians by Householder Income Over 65 years
In terms of householder income over 65 years, the demographic groups most similar to Trinidadians and Tobagonians are German Russian ($55,356, a difference of 0.050%), Immigrants from Bangladesh ($55,394, a difference of 0.12%), American ($55,527, a difference of 0.36%), Immigrants from Trinidad and Tobago ($55,598, a difference of 0.49%), and Osage ($55,677, a difference of 0.63%).
| Demographics | Rating | Rank | Householder Income Over 65 years |
| Immigrants | Bosnia and Herzegovina | 0.5 /100 | #250 | Tragic $55,986 |
| Immigrants | Portugal | 0.5 /100 | #251 | Tragic $55,924 |
| Osage | 0.4 /100 | #252 | Tragic $55,677 |
| Immigrants | Trinidad and Tobago | 0.4 /100 | #253 | Tragic $55,598 |
| Americans | 0.3 /100 | #254 | Tragic $55,527 |
| Immigrants | Bangladesh | 0.3 /100 | #255 | Tragic $55,394 |
| German Russians | 0.3 /100 | #256 | Tragic $55,356 |
| Trinidadians and Tobagonians | 0.3 /100 | #257 | Tragic $55,327 |
| Ecuadorians | 0.2 /100 | #258 | Tragic $54,958 |
| West Indians | 0.2 /100 | #259 | Tragic $54,936 |
| Immigrants | West Indies | 0.2 /100 | #260 | Tragic $54,927 |
| Comanche | 0.2 /100 | #261 | Tragic $54,922 |
| Bangladeshis | 0.1 /100 | #262 | Tragic $54,719 |
| French American Indians | 0.1 /100 | #263 | Tragic $54,699 |
| Apache | 0.1 /100 | #264 | Tragic $54,668 |
Demographics Similar to Israelis by Householder Income Over 65 years
In terms of householder income over 65 years, the demographic groups most similar to Israelis are Immigrants from Scotland ($66,620, a difference of 0.020%), Immigrants from Pakistan ($66,617, a difference of 0.030%), Immigrants from Turkey ($66,672, a difference of 0.050%), Immigrants from Indonesia ($66,694, a difference of 0.090%), and Immigrants from Netherlands ($66,463, a difference of 0.26%).
| Demographics | Rating | Rank | Householder Income Over 65 years |
| Immigrants | South Africa | 99.9 /100 | #44 | Exceptional $67,234 |
| Immigrants | Afghanistan | 99.8 /100 | #45 | Exceptional $67,007 |
| Cambodians | 99.8 /100 | #46 | Exceptional $66,892 |
| Australians | 99.8 /100 | #47 | Exceptional $66,891 |
| Immigrants | France | 99.8 /100 | #48 | Exceptional $66,826 |
| Immigrants | Indonesia | 99.8 /100 | #49 | Exceptional $66,694 |
| Immigrants | Turkey | 99.7 /100 | #50 | Exceptional $66,672 |
| Israelis | 99.7 /100 | #51 | Exceptional $66,636 |
| Immigrants | Scotland | 99.7 /100 | #52 | Exceptional $66,620 |
| Immigrants | Pakistan | 99.7 /100 | #53 | Exceptional $66,617 |
| Immigrants | Netherlands | 99.7 /100 | #54 | Exceptional $66,463 |
| Immigrants | Czechoslovakia | 99.7 /100 | #55 | Exceptional $66,376 |
| Laotians | 99.6 /100 | #56 | Exceptional $66,306 |
| Bulgarians | 99.6 /100 | #57 | Exceptional $66,236 |
| Immigrants | Philippines | 99.6 /100 | #58 | Exceptional $66,161 |