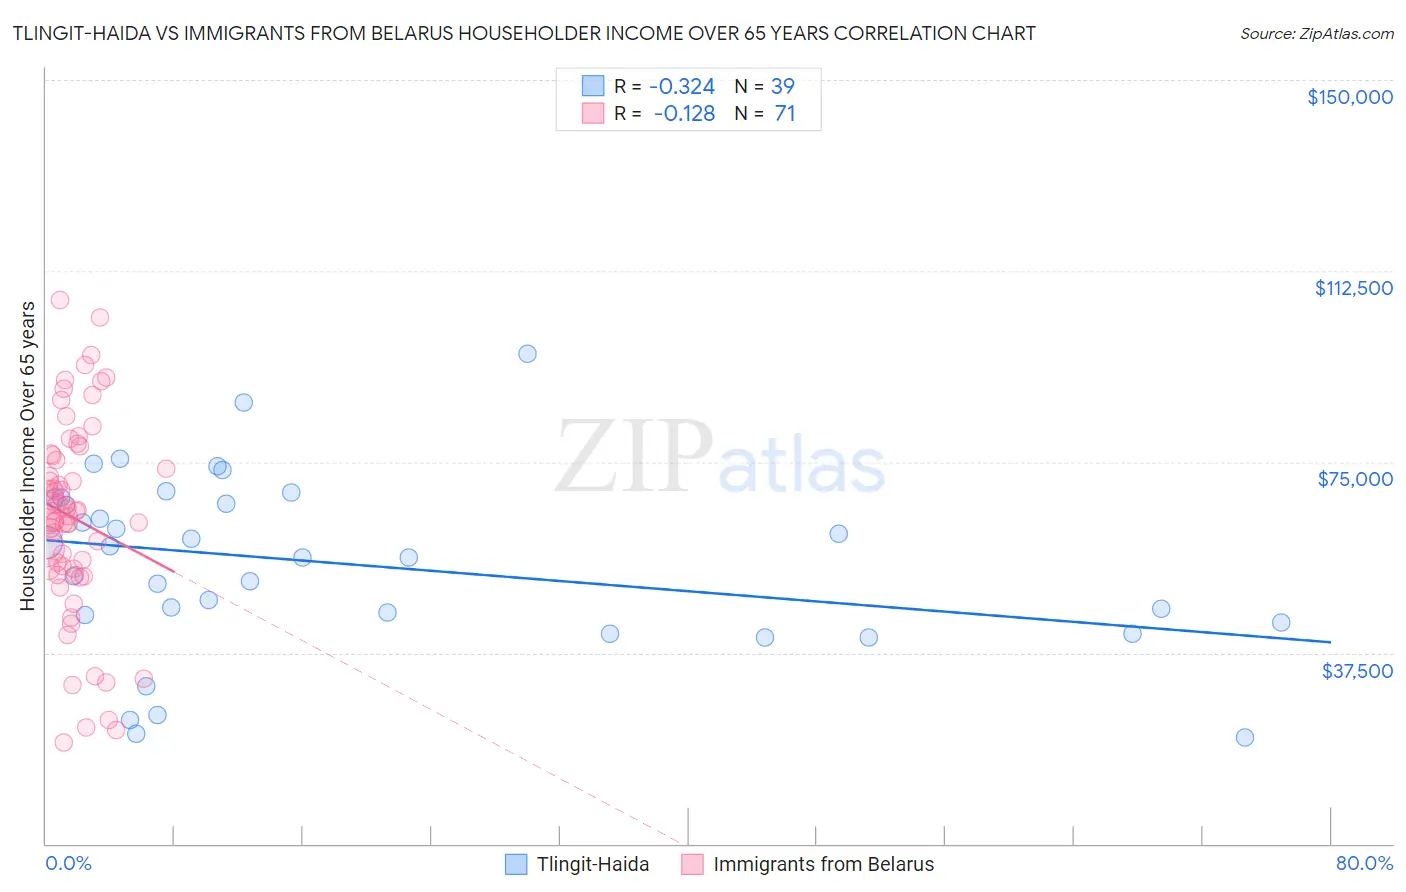
Tlingit-Haida vs Immigrants from Belarus Householder Income Over 65 years
COMPARE
Tlingit-Haida
Immigrants from Belarus
Householder Income Over 65 years
Householder Income Over 65 years Comparison
Tlingit-Haida
Immigrants from Belarus
$62,922
HOUSEHOLDER INCOME OVER 65 YEARS
88.6/ 100
METRIC RATING
123rd/ 347
METRIC RANK
$62,162
HOUSEHOLDER INCOME OVER 65 YEARS
77.8/ 100
METRIC RATING
143rd/ 347
METRIC RANK
Tlingit-Haida vs Immigrants from Belarus Householder Income Over 65 years Correlation Chart
The statistical analysis conducted on geographies consisting of 60,750,081 people shows a mild negative correlation between the proportion of Tlingit-Haida and household income with householder over the age of 65 in the United States with a correlation coefficient (R) of -0.324 and weighted average of $62,922. Similarly, the statistical analysis conducted on geographies consisting of 150,124,953 people shows a poor negative correlation between the proportion of Immigrants from Belarus and household income with householder over the age of 65 in the United States with a correlation coefficient (R) of -0.128 and weighted average of $62,162, a difference of 1.2%.
Householder Income Over 65 years Correlation Summary
| Measurement | Tlingit-Haida | Immigrants from Belarus |
| Minimum | $20,833 | $19,854 |
| Maximum | $96,250 | $106,741 |
| Range | $75,417 | $86,887 |
| Mean | $54,963 | $64,012 |
| Median | $56,173 | $65,250 |
| Interquartile 25% (IQ1) | $43,571 | $53,983 |
| Interquartile 75% (IQ3) | $67,937 | $76,256 |
| Interquartile Range (IQR) | $24,366 | $22,273 |
| Standard Deviation (Sample) | $17,428 | $19,180 |
| Standard Deviation (Population) | $17,203 | $19,044 |
Demographics Similar to Tlingit-Haida and Immigrants from Belarus by Householder Income Over 65 years
In terms of householder income over 65 years, the demographic groups most similar to Tlingit-Haida are Taiwanese ($62,894, a difference of 0.040%), Soviet Union ($62,848, a difference of 0.12%), Peruvian ($62,766, a difference of 0.25%), Swedish ($62,736, a difference of 0.30%), and Aleut ($62,708, a difference of 0.34%). Similarly, the demographic groups most similar to Immigrants from Belarus are South American Indian ($62,215, a difference of 0.090%), Canadian ($62,230, a difference of 0.11%), Arab ($62,266, a difference of 0.17%), Lebanese ($62,287, a difference of 0.20%), and Immigrants from Kazakhstan ($62,292, a difference of 0.21%).
| Demographics | Rating | Rank | Householder Income Over 65 years |
| Tlingit-Haida | 88.6 /100 | #123 | Excellent $62,922 |
| Taiwanese | 88.3 /100 | #124 | Excellent $62,894 |
| Soviet Union | 87.8 /100 | #125 | Excellent $62,848 |
| Peruvians | 86.8 /100 | #126 | Excellent $62,766 |
| Swedes | 86.4 /100 | #127 | Excellent $62,736 |
| Aleuts | 86.1 /100 | #128 | Excellent $62,708 |
| Immigrants | Eastern Europe | 85.9 /100 | #129 | Excellent $62,693 |
| Basques | 85.4 /100 | #130 | Excellent $62,653 |
| Immigrants | Western Asia | 85.3 /100 | #131 | Excellent $62,645 |
| Immigrants | Germany | 83.9 /100 | #132 | Excellent $62,544 |
| Immigrants | Northern Africa | 83.6 /100 | #133 | Excellent $62,522 |
| Immigrants | Brazil | 81.2 /100 | #134 | Excellent $62,364 |
| Immigrants | Chile | 81.0 /100 | #135 | Excellent $62,354 |
| Alaskan Athabascans | 80.6 /100 | #136 | Excellent $62,330 |
| Immigrants | Syria | 80.2 /100 | #137 | Excellent $62,303 |
| Immigrants | Kazakhstan | 80.0 /100 | #138 | Excellent $62,292 |
| Lebanese | 79.9 /100 | #139 | Good $62,287 |
| Arabs | 79.6 /100 | #140 | Good $62,266 |
| Canadians | 79.0 /100 | #141 | Good $62,230 |
| South American Indians | 78.7 /100 | #142 | Good $62,215 |
| Immigrants | Belarus | 77.8 /100 | #143 | Good $62,162 |