Tlingit-Haida vs Yugoslavian Householder Income Over 65 years

COMPARE

Tlingit-Haida
Race
Ancestry
AfghanAfricanAlaska NativeAlaskan AthabascanAlbanianAleutAlsatianAmericanApacheArabArapahoArgentineanArmenianAssyrian/Chaldean/SyriacAustralianAustrianBahamianBangladeshiBarbadianBasqueBelgianBelizeanBermudanBhutaneseBlackfeetBolivianBrazilianBritishBritish West IndianBulgarianBurmeseCajunCambodianCanadianCape VerdeanCarpatho RusynCelticCentral AmericanCentral American IndianCherokeeCheyenneChickasawChileanChineseChippewaChoctawColombianColvilleComancheCosta RicanCreeCreekCroatianCrowCubanCypriotCzechCzechoslovakianDanishDelawareDominicanDutchDutch West IndianEastern EuropeanEcuadorianEgyptianEnglishEstonianEthiopianEuropeanFijianFilipinoFinnishFrenchFrench American IndianFrench CanadianGermanGerman RussianGhanaianGreekGuamanian/ChamorroGuatemalanGuyaneseHaitianHmongHonduranHopiHoumaHungarianIcelanderIndian (Asian)IndonesianInupiatIranianIraqiIrishIroquoisIsraeliItalianJamaicanJapaneseJordanianKenyanKiowaKoreanLaotianLatvianLebaneseLiberianLithuanianLumbeeLuxembourgerMacedonianMalaysianMalteseMarshalleseMenomineeMexicanMexican American IndianMongolianMoroccanNative HawaiianNavajoNepaleseNew ZealanderNicaraguanNigerianNorthern EuropeanNorwegianOkinawanOsageOttawaPaiutePakistaniPalestinianPanamanianParaguayanPennsylvania GermanPeruvianPimaPolishPortuguesePotawatomiPuebloPuerto RicanPuget Sound SalishRomanianRussianSalvadoranSamoanScandinavianScotch-IrishScottishSeminoleSenegaleseSerbianShoshoneSierra LeoneanSiouxSlavicSlovakSloveneSomaliSouth AfricanSouth AmericanSouth American IndianSoviet UnionSpaniardSpanishSpanish AmericanSpanish American IndianSri LankanSubsaharan AfricanSudaneseSwedishSwissSyrianTaiwaneseThaiTlingit-HaidaTohono O'OdhamTonganTrinidadian and TobagonianTsimshianTurkishU.S. Virgin IslanderUgandanUkrainianUruguayanUteVenezuelanVietnameseWelshWest IndianYakamaYaquiYumanYup'ikZimbabwean
Immigration
NonimmigrantsImmigrantsAfghanistanAfricaAlbaniaArgentinaArmeniaAsiaAustraliaAustriaBahamasBangladeshBarbadosBelarusBelgiumBelizeBoliviaBosnia and HerzegovinaBrazilBulgariaBurma/MyanmarCabo VerdeCambodiaCameroonCanadaCaribbeanCentral AmericaChileChinaColombiaCongoCosta RicaCroatiaCubaCzechoslovakiaDenmarkDominicaDominican RepublicEastern AfricaEastern AsiaEastern EuropeEcuadorEgyptEl SalvadorEnglandEritreaEthiopiaEuropeFijiFranceGermanyGhanaGreeceGrenadaGuatemalaGuyanaHaitiHondurasHong KongHungaryIndiaIndonesiaIranIraqIrelandIsraelItalyJamaicaJapanJordanKazakhstanKenyaKoreaKuwaitLaosLatin AmericaLatviaLebanonLiberiaLithuaniaMalaysiaMexicoMicronesiaMiddle AfricaMoldovaMoroccoNepalNetherlandsNicaraguaNigeriaNorth AmericaNorth MacedoniaNorthern AfricaNorthern EuropeNorwayOceaniaPakistanPanamaPeruPhilippinesPolandPortugalRomaniaRussiaSaudi ArabiaScotlandSenegalSerbiaSierra LeoneSingaporeSomaliaSouth AfricaSouth AmericaSouth Central AsiaSouth Eastern AsiaSouthern EuropeSpainSri LankaSt. Vincent and the GrenadinesSudanSwedenSwitzerlandSyriaTaiwanThailandTrinidad and TobagoTurkeyUgandaUkraineUruguayUzbekistanVenezuelaVietnamWest IndiesWestern AfricaWestern AsiaWestern EuropeYemenZaireZimbabweAzores
Yugoslavian
Race
Ancestry
AfghanAfricanAlaska NativeAlaskan AthabascanAlbanianAleutAlsatianAmericanApacheArabArapahoArgentineanArmenianAssyrian/Chaldean/SyriacAustralianAustrianBahamianBangladeshiBarbadianBasqueBelgianBelizeanBermudanBhutaneseBlackfeetBolivianBrazilianBritishBritish West IndianBulgarianBurmeseCajunCambodianCanadianCape VerdeanCarpatho RusynCelticCentral AmericanCentral American IndianCherokeeCheyenneChickasawChileanChineseChippewaChoctawColombianColvilleComancheCosta RicanCreeCreekCroatianCrowCubanCypriotCzechCzechoslovakianDanishDelawareDominicanDutchDutch West IndianEastern EuropeanEcuadorianEgyptianEnglishEstonianEthiopianEuropeanFijianFilipinoFinnishFrenchFrench American IndianFrench CanadianGermanGerman RussianGhanaianGreekGuamanian/ChamorroGuatemalanGuyaneseHaitianHmongHonduranHopiHoumaHungarianIcelanderIndian (Asian)IndonesianInupiatIranianIraqiIrishIroquoisIsraeliItalianJamaicanJapaneseJordanianKenyanKiowaKoreanLaotianLatvianLebaneseLiberianLithuanianLumbeeLuxembourgerMacedonianMalaysianMalteseMarshalleseMenomineeMexicanMexican American IndianMongolianMoroccanNative HawaiianNavajoNepaleseNew ZealanderNicaraguanNigerianNorthern EuropeanNorwegianOkinawanOsageOttawaPaiutePakistaniPalestinianPanamanianParaguayanPennsylvania GermanPeruvianPimaPolishPortuguesePotawatomiPuebloPuerto RicanPuget Sound SalishRomanianRussianSalvadoranSamoanScandinavianScotch-IrishScottishSeminoleSenegaleseSerbianShoshoneSierra LeoneanSiouxSlavicSlovakSloveneSomaliSouth AfricanSouth AmericanSouth American IndianSoviet UnionSpaniardSpanishSpanish AmericanSpanish American IndianSri LankanSubsaharan AfricanSudaneseSwedishSwissSyrianTaiwaneseThaiTohono O'OdhamTonganTrinidadian and TobagonianTsimshianTurkishU.S. Virgin IslanderUgandanUkrainianUruguayanUteVenezuelanVietnameseWelshWest IndianYakamaYaquiYugoslavianYumanYup'ikZimbabwean
Immigration
NonimmigrantsImmigrantsAfghanistanAfricaAlbaniaArgentinaArmeniaAsiaAustraliaAustriaBahamasBangladeshBarbadosBelarusBelgiumBelizeBoliviaBosnia and HerzegovinaBrazilBulgariaBurma/MyanmarCabo VerdeCambodiaCameroonCanadaCaribbeanCentral AmericaChileChinaColombiaCongoCosta RicaCroatiaCubaCzechoslovakiaDenmarkDominicaDominican RepublicEastern AfricaEastern AsiaEastern EuropeEcuadorEgyptEl SalvadorEnglandEritreaEthiopiaEuropeFijiFranceGermanyGhanaGreeceGrenadaGuatemalaGuyanaHaitiHondurasHong KongHungaryIndiaIndonesiaIranIraqIrelandIsraelItalyJamaicaJapanJordanKazakhstanKenyaKoreaKuwaitLaosLatin AmericaLatviaLebanonLiberiaLithuaniaMalaysiaMexicoMicronesiaMiddle AfricaMoldovaMoroccoNepalNetherlandsNicaraguaNigeriaNorth AmericaNorth MacedoniaNorthern AfricaNorthern EuropeNorwayOceaniaPakistanPanamaPeruPhilippinesPolandPortugalRomaniaRussiaSaudi ArabiaScotlandSenegalSerbiaSierra LeoneSingaporeSomaliaSouth AfricaSouth AmericaSouth Central AsiaSouth Eastern AsiaSouthern EuropeSpainSri LankaSt. Vincent and the GrenadinesSudanSwedenSwitzerlandSyriaTaiwanThailandTrinidad and TobagoTurkeyUgandaUkraineUruguayUzbekistanVenezuelaVietnamWest IndiesWestern AfricaWestern AsiaWestern EuropeYemenZaireZimbabweAzores
Householder Income Over 65 years
Income
Poverty
Unemployment
Labor Participation
Family Structure
Vehicle Availability
Education Level
Disability

Householder Income Over 65 years Comparison

Tlingit-Haida

Yugoslavians

Excellent
Tragic
$62,922
HOUSEHOLDER INCOME OVER 65 YEARS
88.6/ 100
METRIC RATING
123rd/ 347
METRIC RANK
$58,243
HOUSEHOLDER INCOME OVER 65 YEARS
5.5/ 100
METRIC RATING
220th/ 347
METRIC RANK

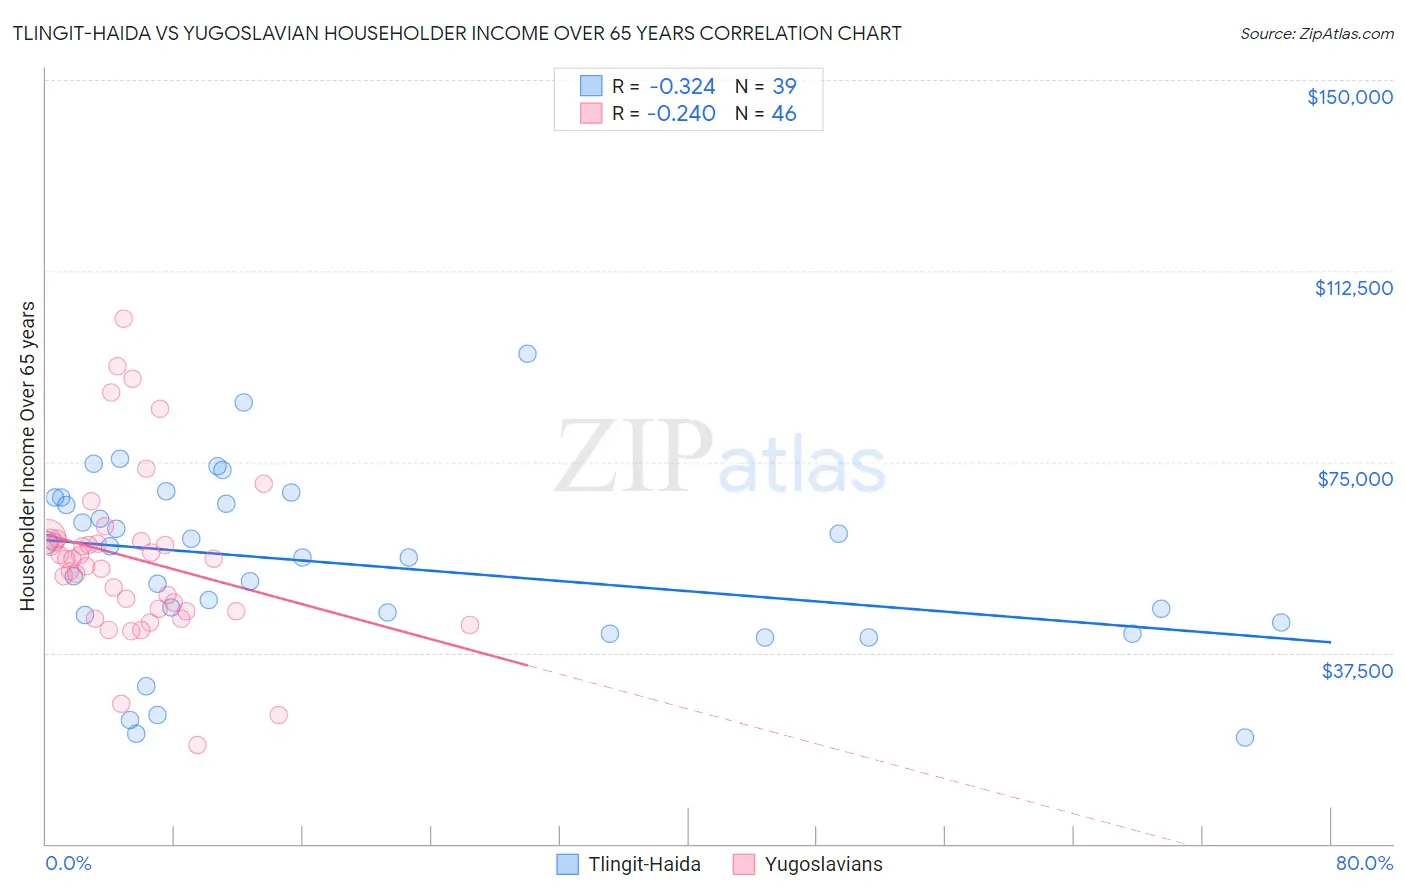
Tlingit-Haida vs Yugoslavian Householder Income Over 65 years Correlation Chart

The statistical analysis conducted on geographies consisting of 60,750,081 people shows a mild negative correlation between the proportion of Tlingit-Haida and household income with householder over the age of 65 in the United States with a correlation coefficient (R) of -0.324 and weighted average of $62,922. Similarly, the statistical analysis conducted on geographies consisting of 285,278,899 people shows a weak negative correlation between the proportion of Yugoslavians and household income with householder over the age of 65 in the United States with a correlation coefficient (R) of -0.240 and weighted average of $58,243, a difference of 8.0%.
Tlingit-Haida vs Yugoslavian Householder Income Over 65 years

Householder Income Over 65 years Correlation Summary

MeasurementTlingit-HaidaYugoslavian
Minimum$20,833$19,307
Maximum$96,250$103,095
Range$75,417$83,788
Mean$54,963$56,075
Median$56,173$55,920
Interquartile 25% (IQ1)$43,571$45,775
Interquartile 75% (IQ3)$67,937$59,846
Interquartile Range (IQR)$24,366$14,071
Standard Deviation (Sample)$17,428$16,651
Standard Deviation (Population)$17,203$16,469

Similar Demographics by Householder Income Over 65 years

Demographics Similar to Tlingit-Haida by Householder Income Over 65 years

In terms of householder income over 65 years, the demographic groups most similar to Tlingit-Haida are Immigrants from Moldova ($62,939, a difference of 0.030%), Taiwanese ($62,894, a difference of 0.040%), Soviet Union ($62,848, a difference of 0.12%), Immigrants from Vietnam ($63,014, a difference of 0.15%), and Ukrainian ($63,032, a difference of 0.18%).
DemographicsRating | RankHouseholder Income Over 65 years
Guamanians/Chamorros
91.1
/100
|
#116
Exceptional
$63,187
Immigrants | Croatia
90.9
/100
|
#117
Exceptional
$63,168
Danes
90.5
/100
|
#118
Exceptional
$63,117
Immigrants | Jordan
89.8
/100
|
#119
Excellent
$63,041
Ukrainians
89.7
/100
|
#120
Excellent
$63,032
Immigrants | Vietnam
89.5
/100
|
#121
Excellent
$63,014
Immigrants | Moldova
88.7
/100
|
#122
Excellent
$62,939
Tlingit-Haida
88.6
/100
|
#123
Excellent
$62,922
Taiwanese
88.3
/100
|
#124
Excellent
$62,894
Soviet Union
87.8
/100
|
#125
Excellent
$62,848
Peruvians
86.8
/100
|
#126
Excellent
$62,766
Swedes
86.4
/100
|
#127
Excellent
$62,736
Aleuts
86.1
/100
|
#128
Excellent
$62,708
Immigrants | Eastern Europe
85.9
/100
|
#129
Excellent
$62,693
Basques
85.4
/100
|
#130
Excellent
$62,653

Demographics Similar to Yugoslavians by Householder Income Over 65 years

In terms of householder income over 65 years, the demographic groups most similar to Yugoslavians are Malaysian ($58,244, a difference of 0.0%), Immigrants from El Salvador ($58,226, a difference of 0.030%), Panamanian ($58,266, a difference of 0.040%), Delaware ($58,214, a difference of 0.050%), and Sudanese ($58,281, a difference of 0.070%).
DemographicsRating | RankHouseholder Income Over 65 years
Whites/Caucasians
9.8
/100
|
#213
Tragic
$58,847
Nepalese
9.0
/100
|
#214
Tragic
$58,761
Immigrants | Ghana
7.9
/100
|
#215
Tragic
$58,624
Immigrants | Middle Africa
6.2
/100
|
#216
Tragic
$58,375
Sudanese
5.7
/100
|
#217
Tragic
$58,281
Panamanians
5.6
/100
|
#218
Tragic
$58,266
Malaysians
5.5
/100
|
#219
Tragic
$58,244
Yugoslavians
5.5
/100
|
#220
Tragic
$58,243
Immigrants | El Salvador
5.4
/100
|
#221
Tragic
$58,226
Delaware
5.3
/100
|
#222
Tragic
$58,214
Tsimshian
5.2
/100
|
#223
Tragic
$58,202
Bermudans
5.1
/100
|
#224
Tragic
$58,171
Venezuelans
4.4
/100
|
#225
Tragic
$58,026
French Canadians
4.2
/100
|
#226
Tragic
$57,975
Japanese
3.9
/100
|
#227
Tragic
$57,919