Tlingit-Haida vs Bermudan Householder Income Over 65 years
COMPARE
Tlingit-Haida
Bermudan
Householder Income Over 65 years
Householder Income Over 65 years Comparison
Tlingit-Haida
Bermudans
$62,922
HOUSEHOLDER INCOME OVER 65 YEARS
88.6/ 100
METRIC RATING
123rd/ 347
METRIC RANK
$58,171
HOUSEHOLDER INCOME OVER 65 YEARS
5.1/ 100
METRIC RATING
224th/ 347
METRIC RANK
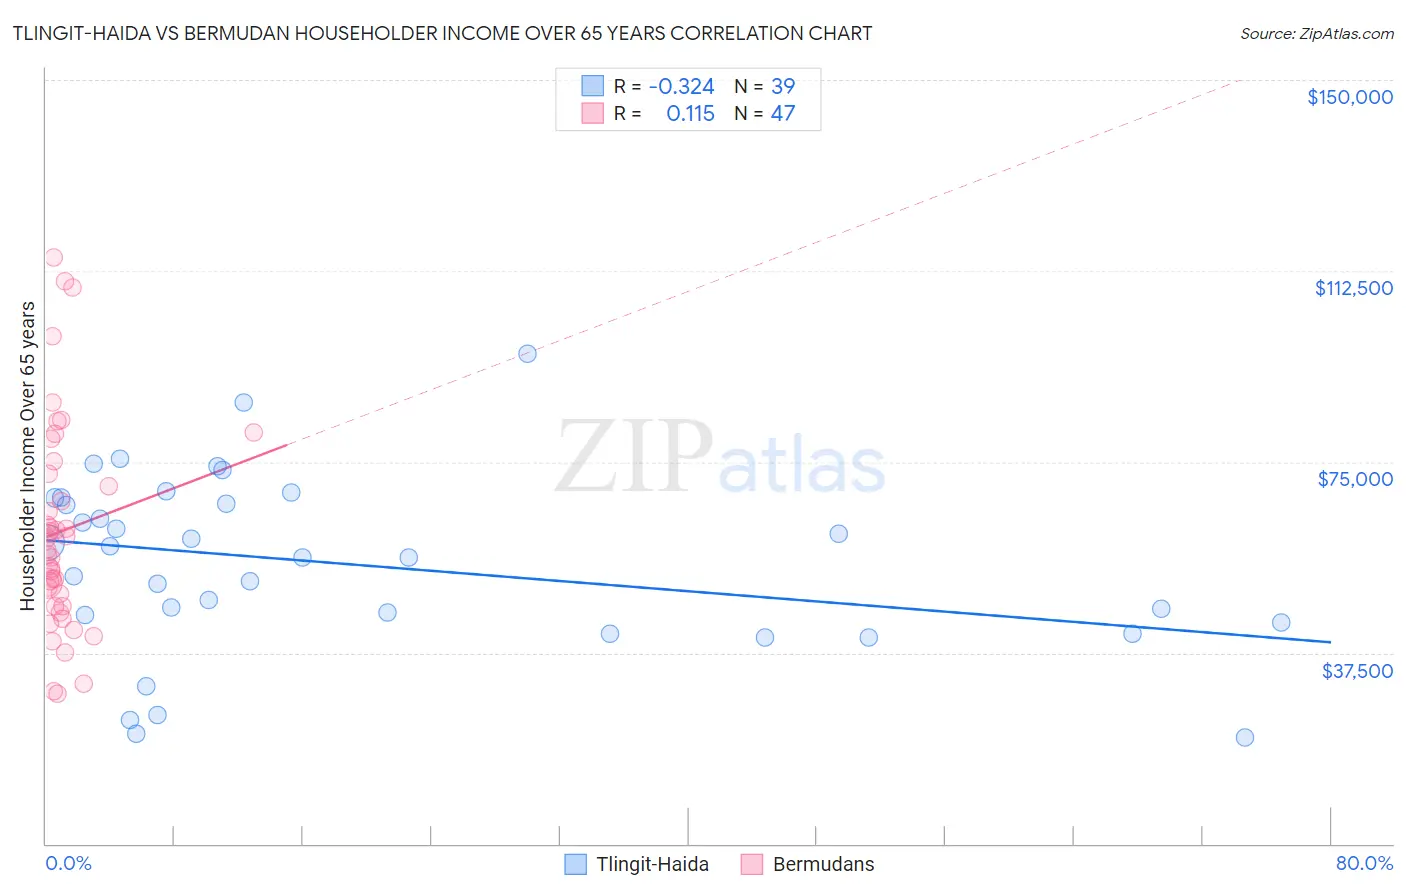
Tlingit-Haida vs Bermudan Householder Income Over 65 years Correlation Chart
The statistical analysis conducted on geographies consisting of 60,750,081 people shows a mild negative correlation between the proportion of Tlingit-Haida and household income with householder over the age of 65 in the United States with a correlation coefficient (R) of -0.324 and weighted average of $62,922. Similarly, the statistical analysis conducted on geographies consisting of 55,673,391 people shows a poor positive correlation between the proportion of Bermudans and household income with householder over the age of 65 in the United States with a correlation coefficient (R) of 0.115 and weighted average of $58,171, a difference of 8.2%.
Householder Income Over 65 years Correlation Summary
| Measurement | Tlingit-Haida | Bermudan |
| Minimum | $20,833 | $29,369 |
| Maximum | $96,250 | $115,179 |
| Range | $75,417 | $85,810 |
| Mean | $54,963 | $61,411 |
| Median | $56,173 | $57,809 |
| Interquartile 25% (IQ1) | $43,571 | $46,689 |
| Interquartile 75% (IQ3) | $67,937 | $72,720 |
| Interquartile Range (IQR) | $24,366 | $26,031 |
| Standard Deviation (Sample) | $17,428 | $20,368 |
| Standard Deviation (Population) | $17,203 | $20,150 |
Similar Demographics by Householder Income Over 65 years
Demographics Similar to Tlingit-Haida by Householder Income Over 65 years
In terms of householder income over 65 years, the demographic groups most similar to Tlingit-Haida are Immigrants from Moldova ($62,939, a difference of 0.030%), Taiwanese ($62,894, a difference of 0.040%), Soviet Union ($62,848, a difference of 0.12%), Immigrants from Vietnam ($63,014, a difference of 0.15%), and Ukrainian ($63,032, a difference of 0.18%).
| Demographics | Rating | Rank | Householder Income Over 65 years |
| Guamanians/Chamorros | 91.1 /100 | #116 | Exceptional $63,187 |
| Immigrants | Croatia | 90.9 /100 | #117 | Exceptional $63,168 |
| Danes | 90.5 /100 | #118 | Exceptional $63,117 |
| Immigrants | Jordan | 89.8 /100 | #119 | Excellent $63,041 |
| Ukrainians | 89.7 /100 | #120 | Excellent $63,032 |
| Immigrants | Vietnam | 89.5 /100 | #121 | Excellent $63,014 |
| Immigrants | Moldova | 88.7 /100 | #122 | Excellent $62,939 |
| Tlingit-Haida | 88.6 /100 | #123 | Excellent $62,922 |
| Taiwanese | 88.3 /100 | #124 | Excellent $62,894 |
| Soviet Union | 87.8 /100 | #125 | Excellent $62,848 |
| Peruvians | 86.8 /100 | #126 | Excellent $62,766 |
| Swedes | 86.4 /100 | #127 | Excellent $62,736 |
| Aleuts | 86.1 /100 | #128 | Excellent $62,708 |
| Immigrants | Eastern Europe | 85.9 /100 | #129 | Excellent $62,693 |
| Basques | 85.4 /100 | #130 | Excellent $62,653 |
Demographics Similar to Bermudans by Householder Income Over 65 years
In terms of householder income over 65 years, the demographic groups most similar to Bermudans are Tsimshian ($58,202, a difference of 0.050%), Delaware ($58,214, a difference of 0.080%), Immigrants from El Salvador ($58,226, a difference of 0.10%), Yugoslavian ($58,243, a difference of 0.12%), and Malaysian ($58,244, a difference of 0.13%).
| Demographics | Rating | Rank | Householder Income Over 65 years |
| Sudanese | 5.7 /100 | #217 | Tragic $58,281 |
| Panamanians | 5.6 /100 | #218 | Tragic $58,266 |
| Malaysians | 5.5 /100 | #219 | Tragic $58,244 |
| Yugoslavians | 5.5 /100 | #220 | Tragic $58,243 |
| Immigrants | El Salvador | 5.4 /100 | #221 | Tragic $58,226 |
| Delaware | 5.3 /100 | #222 | Tragic $58,214 |
| Tsimshian | 5.2 /100 | #223 | Tragic $58,202 |
| Bermudans | 5.1 /100 | #224 | Tragic $58,171 |
| Venezuelans | 4.4 /100 | #225 | Tragic $58,026 |
| French Canadians | 4.2 /100 | #226 | Tragic $57,975 |
| Japanese | 3.9 /100 | #227 | Tragic $57,919 |
| Immigrants | Albania | 3.6 /100 | #228 | Tragic $57,828 |
| Immigrants | Colombia | 3.0 /100 | #229 | Tragic $57,658 |
| Immigrants | Cambodia | 2.8 /100 | #230 | Tragic $57,580 |
| Immigrants | Nonimmigrants | 2.4 /100 | #231 | Tragic $57,426 |