Tlingit-Haida vs Bahamian Householder Income Over 65 years
COMPARE
Tlingit-Haida
Bahamian
Householder Income Over 65 years
Householder Income Over 65 years Comparison
Tlingit-Haida
Bahamians
$62,922
HOUSEHOLDER INCOME OVER 65 YEARS
88.6/ 100
METRIC RATING
123rd/ 347
METRIC RANK
$51,000
HOUSEHOLDER INCOME OVER 65 YEARS
0.0/ 100
METRIC RATING
327th/ 347
METRIC RANK
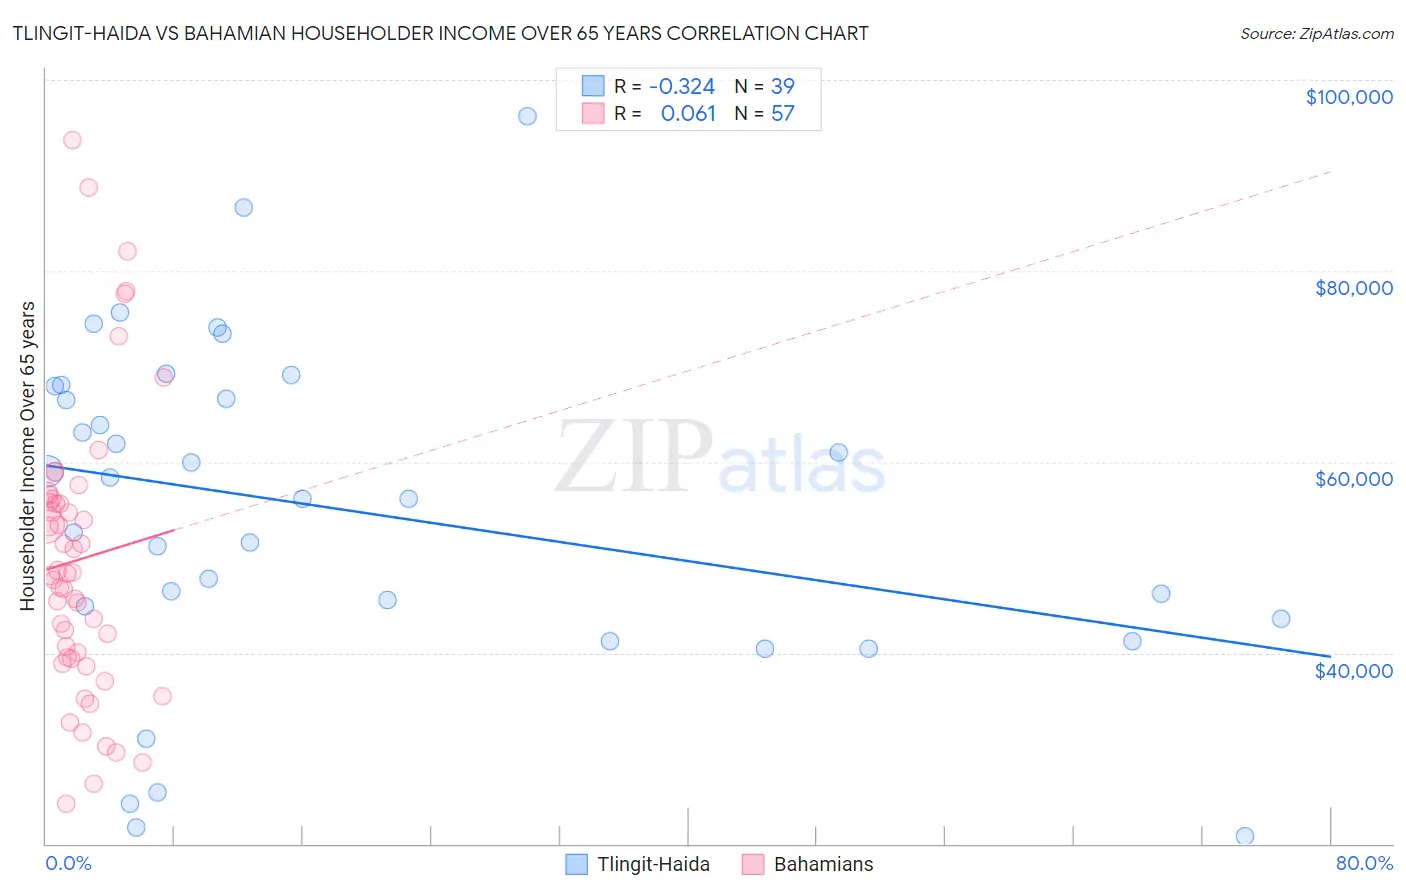
Tlingit-Haida vs Bahamian Householder Income Over 65 years Correlation Chart
The statistical analysis conducted on geographies consisting of 60,750,081 people shows a mild negative correlation between the proportion of Tlingit-Haida and household income with householder over the age of 65 in the United States with a correlation coefficient (R) of -0.324 and weighted average of $62,922. Similarly, the statistical analysis conducted on geographies consisting of 112,449,613 people shows a slight positive correlation between the proportion of Bahamians and household income with householder over the age of 65 in the United States with a correlation coefficient (R) of 0.061 and weighted average of $51,000, a difference of 23.4%.
Householder Income Over 65 years Correlation Summary
| Measurement | Tlingit-Haida | Bahamian |
| Minimum | $20,833 | $24,158 |
| Maximum | $96,250 | $93,779 |
| Range | $75,417 | $69,621 |
| Mean | $54,963 | $49,773 |
| Median | $56,173 | $48,251 |
| Interquartile 25% (IQ1) | $43,571 | $39,444 |
| Interquartile 75% (IQ3) | $67,937 | $55,975 |
| Interquartile Range (IQR) | $24,366 | $16,531 |
| Standard Deviation (Sample) | $17,428 | $14,935 |
| Standard Deviation (Population) | $17,203 | $14,804 |
Similar Demographics by Householder Income Over 65 years
Demographics Similar to Tlingit-Haida by Householder Income Over 65 years
In terms of householder income over 65 years, the demographic groups most similar to Tlingit-Haida are Immigrants from Moldova ($62,939, a difference of 0.030%), Taiwanese ($62,894, a difference of 0.040%), Soviet Union ($62,848, a difference of 0.12%), Immigrants from Vietnam ($63,014, a difference of 0.15%), and Ukrainian ($63,032, a difference of 0.18%).
| Demographics | Rating | Rank | Householder Income Over 65 years |
| Guamanians/Chamorros | 91.1 /100 | #116 | Exceptional $63,187 |
| Immigrants | Croatia | 90.9 /100 | #117 | Exceptional $63,168 |
| Danes | 90.5 /100 | #118 | Exceptional $63,117 |
| Immigrants | Jordan | 89.8 /100 | #119 | Excellent $63,041 |
| Ukrainians | 89.7 /100 | #120 | Excellent $63,032 |
| Immigrants | Vietnam | 89.5 /100 | #121 | Excellent $63,014 |
| Immigrants | Moldova | 88.7 /100 | #122 | Excellent $62,939 |
| Tlingit-Haida | 88.6 /100 | #123 | Excellent $62,922 |
| Taiwanese | 88.3 /100 | #124 | Excellent $62,894 |
| Soviet Union | 87.8 /100 | #125 | Excellent $62,848 |
| Peruvians | 86.8 /100 | #126 | Excellent $62,766 |
| Swedes | 86.4 /100 | #127 | Excellent $62,736 |
| Aleuts | 86.1 /100 | #128 | Excellent $62,708 |
| Immigrants | Eastern Europe | 85.9 /100 | #129 | Excellent $62,693 |
| Basques | 85.4 /100 | #130 | Excellent $62,653 |
Demographics Similar to Bahamians by Householder Income Over 65 years
In terms of householder income over 65 years, the demographic groups most similar to Bahamians are Hopi ($50,925, a difference of 0.15%), Kiowa ($51,140, a difference of 0.28%), Immigrants from Haiti ($51,219, a difference of 0.43%), Black/African American ($50,779, a difference of 0.44%), and Immigrants from Grenada ($50,747, a difference of 0.50%).
| Demographics | Rating | Rank | Householder Income Over 65 years |
| Colville | 0.0 /100 | #320 | Tragic $51,739 |
| Menominee | 0.0 /100 | #321 | Tragic $51,719 |
| British West Indians | 0.0 /100 | #322 | Tragic $51,463 |
| Cajuns | 0.0 /100 | #323 | Tragic $51,397 |
| Immigrants | Congo | 0.0 /100 | #324 | Tragic $51,393 |
| Immigrants | Haiti | 0.0 /100 | #325 | Tragic $51,219 |
| Kiowa | 0.0 /100 | #326 | Tragic $51,140 |
| Bahamians | 0.0 /100 | #327 | Tragic $51,000 |
| Hopi | 0.0 /100 | #328 | Tragic $50,925 |
| Blacks/African Americans | 0.0 /100 | #329 | Tragic $50,779 |
| Immigrants | Grenada | 0.0 /100 | #330 | Tragic $50,747 |
| Pima | 0.0 /100 | #331 | Tragic $50,539 |
| Dutch West Indians | 0.0 /100 | #332 | Tragic $50,475 |
| Cape Verdeans | 0.0 /100 | #333 | Tragic $50,077 |
| Immigrants | Dominica | 0.0 /100 | #334 | Tragic $50,071 |