Estonian vs Israeli Householder Income Over 65 years
COMPARE
Estonian
Israeli
Householder Income Over 65 years
Householder Income Over 65 years Comparison
Estonians
Israelis
$67,926
HOUSEHOLDER INCOME OVER 65 YEARS
99.9/ 100
METRIC RATING
38th/ 347
METRIC RANK
$66,636
HOUSEHOLDER INCOME OVER 65 YEARS
99.7/ 100
METRIC RATING
51st/ 347
METRIC RANK
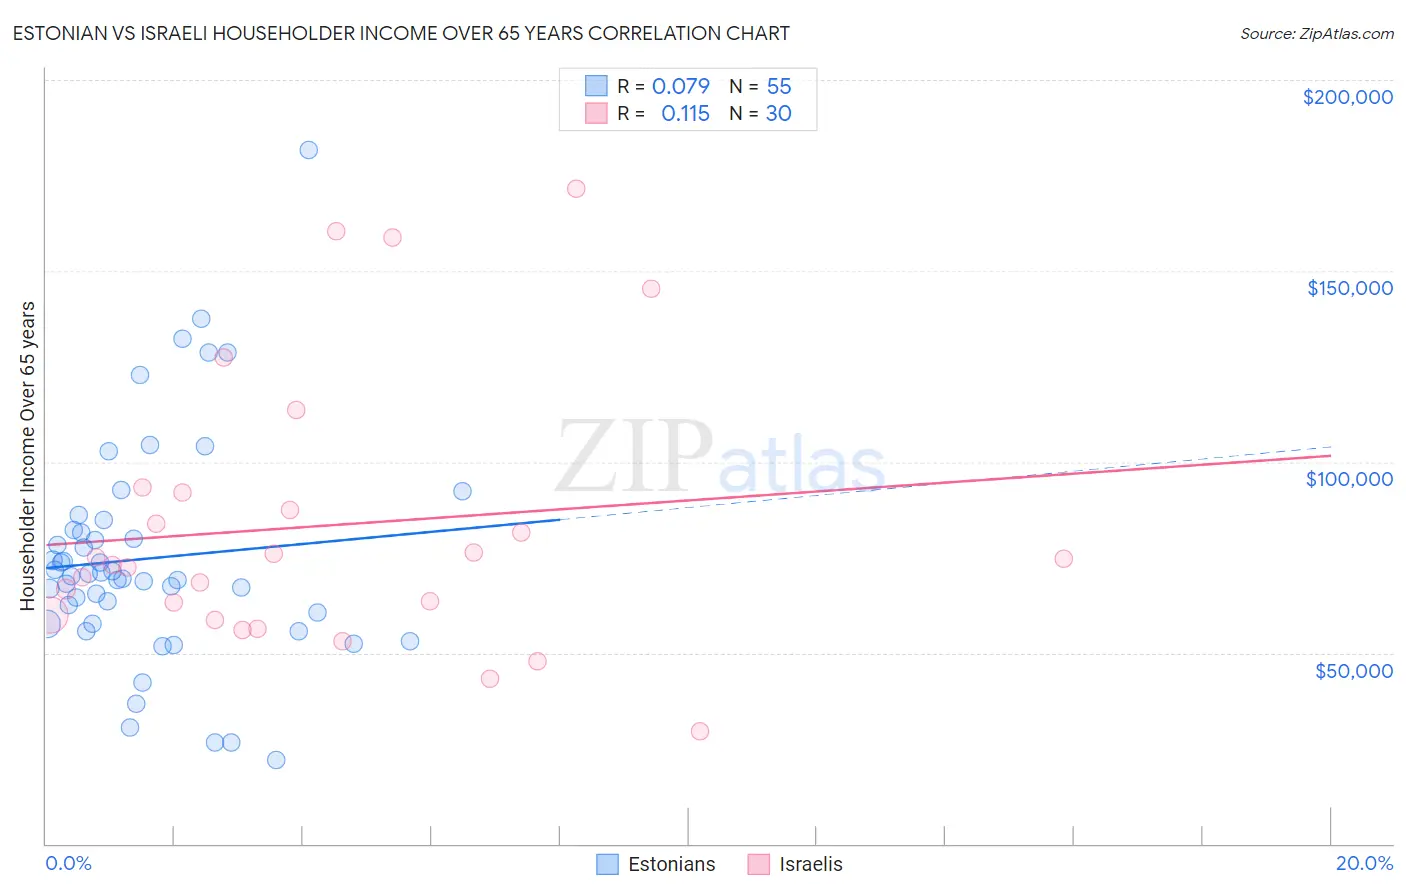
Estonian vs Israeli Householder Income Over 65 years Correlation Chart
The statistical analysis conducted on geographies consisting of 123,423,480 people shows a slight positive correlation between the proportion of Estonians and household income with householder over the age of 65 in the United States with a correlation coefficient (R) of 0.079 and weighted average of $67,926. Similarly, the statistical analysis conducted on geographies consisting of 210,595,359 people shows a poor positive correlation between the proportion of Israelis and household income with householder over the age of 65 in the United States with a correlation coefficient (R) of 0.115 and weighted average of $66,636, a difference of 1.9%.
Householder Income Over 65 years Correlation Summary
| Measurement | Estonian | Israeli |
| Minimum | $21,786 | $29,457 |
| Maximum | $181,719 | $171,563 |
| Range | $159,933 | $142,106 |
| Mean | $74,728 | $83,272 |
| Median | $70,115 | $73,731 |
| Interquartile 25% (IQ1) | $57,743 | $59,859 |
| Interquartile 75% (IQ3) | $82,145 | $92,033 |
| Interquartile Range (IQR) | $24,401 | $32,174 |
| Standard Deviation (Sample) | $29,421 | $36,038 |
| Standard Deviation (Population) | $29,152 | $35,432 |
Demographics Similar to Estonians and Israelis by Householder Income Over 65 years
In terms of householder income over 65 years, the demographic groups most similar to Estonians are Turkish ($68,037, a difference of 0.16%), Immigrants from Austria ($68,208, a difference of 0.42%), Russian ($67,626, a difference of 0.44%), Tongan ($68,235, a difference of 0.46%), and Immigrants from Asia ($67,594, a difference of 0.49%). Similarly, the demographic groups most similar to Israelis are Immigrants from Scotland ($66,620, a difference of 0.020%), Immigrants from Pakistan ($66,617, a difference of 0.030%), Immigrants from Turkey ($66,672, a difference of 0.050%), Immigrants from Indonesia ($66,694, a difference of 0.090%), and Immigrants from Netherlands ($66,463, a difference of 0.26%).
| Demographics | Rating | Rank | Householder Income Over 65 years |
| Immigrants | Ireland | 100.0 /100 | #34 | Exceptional $68,495 |
| Tongans | 100.0 /100 | #35 | Exceptional $68,235 |
| Immigrants | Austria | 99.9 /100 | #36 | Exceptional $68,208 |
| Turks | 99.9 /100 | #37 | Exceptional $68,037 |
| Estonians | 99.9 /100 | #38 | Exceptional $67,926 |
| Russians | 99.9 /100 | #39 | Exceptional $67,626 |
| Immigrants | Asia | 99.9 /100 | #40 | Exceptional $67,594 |
| Koreans | 99.9 /100 | #41 | Exceptional $67,472 |
| New Zealanders | 99.9 /100 | #42 | Exceptional $67,333 |
| Latvians | 99.9 /100 | #43 | Exceptional $67,326 |
| Immigrants | South Africa | 99.9 /100 | #44 | Exceptional $67,234 |
| Immigrants | Afghanistan | 99.8 /100 | #45 | Exceptional $67,007 |
| Cambodians | 99.8 /100 | #46 | Exceptional $66,892 |
| Australians | 99.8 /100 | #47 | Exceptional $66,891 |
| Immigrants | France | 99.8 /100 | #48 | Exceptional $66,826 |
| Immigrants | Indonesia | 99.8 /100 | #49 | Exceptional $66,694 |
| Immigrants | Turkey | 99.7 /100 | #50 | Exceptional $66,672 |
| Israelis | 99.7 /100 | #51 | Exceptional $66,636 |
| Immigrants | Scotland | 99.7 /100 | #52 | Exceptional $66,620 |
| Immigrants | Pakistan | 99.7 /100 | #53 | Exceptional $66,617 |
| Immigrants | Netherlands | 99.7 /100 | #54 | Exceptional $66,463 |