Immigrants from Cuba vs Israeli Householder Income Over 65 years
COMPARE
Immigrants from Cuba
Israeli
Householder Income Over 65 years
Householder Income Over 65 years Comparison
Immigrants from Cuba
Israelis
$44,735
HOUSEHOLDER INCOME OVER 65 YEARS
0.0/ 100
METRIC RATING
345th/ 347
METRIC RANK
$66,636
HOUSEHOLDER INCOME OVER 65 YEARS
99.7/ 100
METRIC RATING
51st/ 347
METRIC RANK
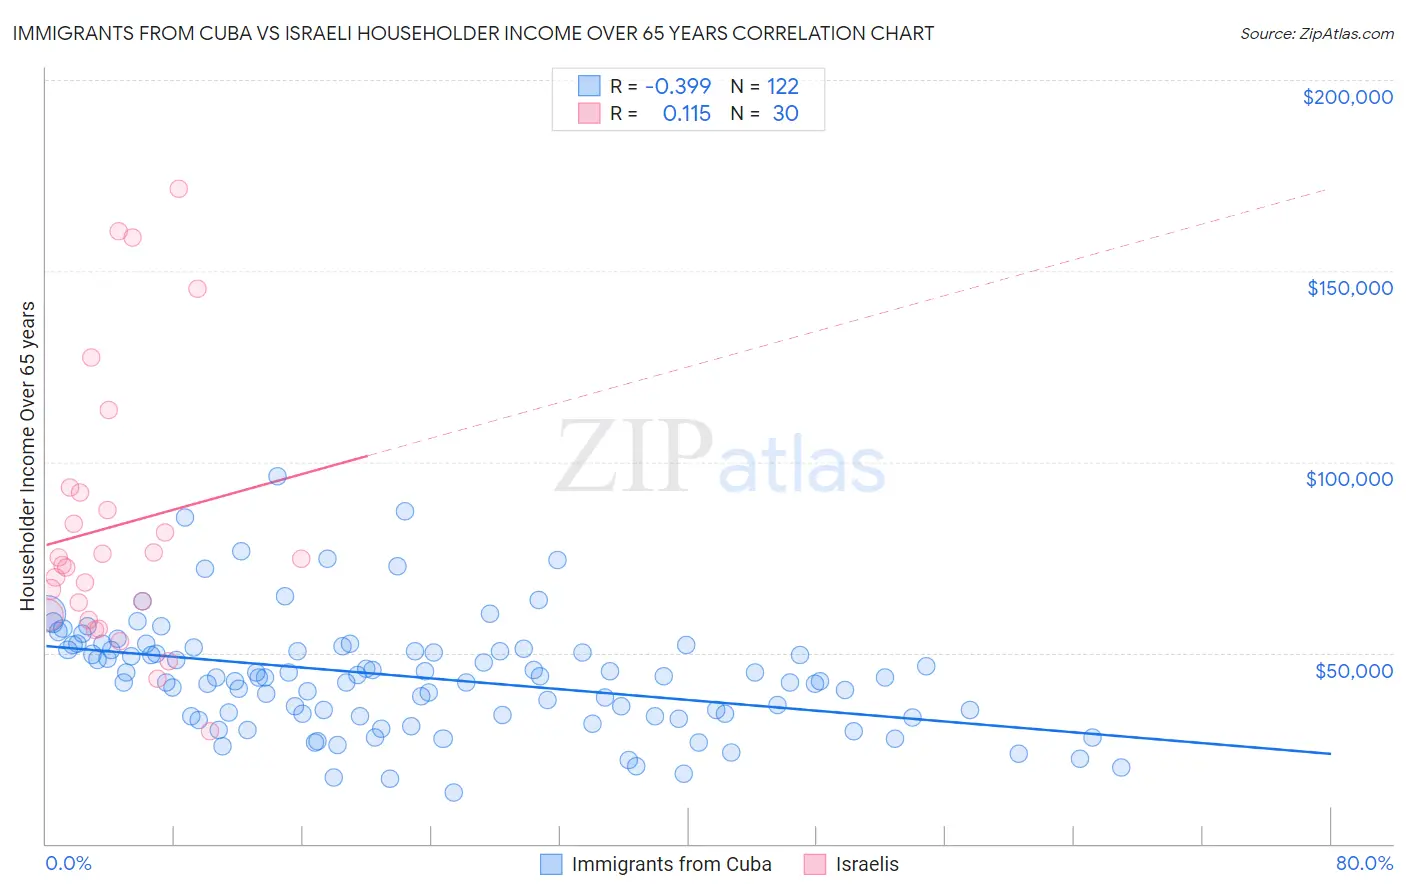
Immigrants from Cuba vs Israeli Householder Income Over 65 years Correlation Chart
The statistical analysis conducted on geographies consisting of 325,279,041 people shows a mild negative correlation between the proportion of Immigrants from Cuba and household income with householder over the age of 65 in the United States with a correlation coefficient (R) of -0.399 and weighted average of $44,735. Similarly, the statistical analysis conducted on geographies consisting of 210,595,359 people shows a poor positive correlation between the proportion of Israelis and household income with householder over the age of 65 in the United States with a correlation coefficient (R) of 0.115 and weighted average of $66,636, a difference of 49.0%.
Householder Income Over 65 years Correlation Summary
| Measurement | Immigrants from Cuba | Israeli |
| Minimum | $13,371 | $29,457 |
| Maximum | $96,328 | $171,563 |
| Range | $82,957 | $142,106 |
| Mean | $43,660 | $83,272 |
| Median | $43,594 | $73,731 |
| Interquartile 25% (IQ1) | $33,500 | $59,859 |
| Interquartile 75% (IQ3) | $50,867 | $92,033 |
| Interquartile Range (IQR) | $17,367 | $32,174 |
| Standard Deviation (Sample) | $14,765 | $36,038 |
| Standard Deviation (Population) | $14,705 | $35,432 |
Similar Demographics by Householder Income Over 65 years
Demographics Similar to Immigrants from Cuba by Householder Income Over 65 years
In terms of householder income over 65 years, the demographic groups most similar to Immigrants from Cuba are Houma ($44,822, a difference of 0.19%), Immigrants from Dominican Republic ($45,758, a difference of 2.3%), Immigrants from Cabo Verde ($46,654, a difference of 4.3%), Dominican ($46,964, a difference of 5.0%), and Puerto Rican ($42,550, a difference of 5.1%).
| Demographics | Rating | Rank | Householder Income Over 65 years |
| Cape Verdeans | 0.0 /100 | #333 | Tragic $50,077 |
| Immigrants | Dominica | 0.0 /100 | #334 | Tragic $50,071 |
| Crow | 0.0 /100 | #335 | Tragic $49,234 |
| Cubans | 0.0 /100 | #336 | Tragic $49,152 |
| Tohono O'odham | 0.0 /100 | #337 | Tragic $49,121 |
| Immigrants | Caribbean | 0.0 /100 | #338 | Tragic $48,535 |
| Navajo | 0.0 /100 | #339 | Tragic $47,722 |
| Immigrants | Yemen | 0.0 /100 | #340 | Tragic $47,527 |
| Dominicans | 0.0 /100 | #341 | Tragic $46,964 |
| Immigrants | Cabo Verde | 0.0 /100 | #342 | Tragic $46,654 |
| Immigrants | Dominican Republic | 0.0 /100 | #343 | Tragic $45,758 |
| Houma | 0.0 /100 | #344 | Tragic $44,822 |
| Immigrants | Cuba | 0.0 /100 | #345 | Tragic $44,735 |
| Puerto Ricans | 0.0 /100 | #346 | Tragic $42,550 |
| Lumbee | 0.0 /100 | #347 | Tragic $40,550 |
Demographics Similar to Israelis by Householder Income Over 65 years
In terms of householder income over 65 years, the demographic groups most similar to Israelis are Immigrants from Scotland ($66,620, a difference of 0.020%), Immigrants from Pakistan ($66,617, a difference of 0.030%), Immigrants from Turkey ($66,672, a difference of 0.050%), Immigrants from Indonesia ($66,694, a difference of 0.090%), and Immigrants from Netherlands ($66,463, a difference of 0.26%).
| Demographics | Rating | Rank | Householder Income Over 65 years |
| Immigrants | South Africa | 99.9 /100 | #44 | Exceptional $67,234 |
| Immigrants | Afghanistan | 99.8 /100 | #45 | Exceptional $67,007 |
| Cambodians | 99.8 /100 | #46 | Exceptional $66,892 |
| Australians | 99.8 /100 | #47 | Exceptional $66,891 |
| Immigrants | France | 99.8 /100 | #48 | Exceptional $66,826 |
| Immigrants | Indonesia | 99.8 /100 | #49 | Exceptional $66,694 |
| Immigrants | Turkey | 99.7 /100 | #50 | Exceptional $66,672 |
| Israelis | 99.7 /100 | #51 | Exceptional $66,636 |
| Immigrants | Scotland | 99.7 /100 | #52 | Exceptional $66,620 |
| Immigrants | Pakistan | 99.7 /100 | #53 | Exceptional $66,617 |
| Immigrants | Netherlands | 99.7 /100 | #54 | Exceptional $66,463 |
| Immigrants | Czechoslovakia | 99.7 /100 | #55 | Exceptional $66,376 |
| Laotians | 99.6 /100 | #56 | Exceptional $66,306 |
| Bulgarians | 99.6 /100 | #57 | Exceptional $66,236 |
| Immigrants | Philippines | 99.6 /100 | #58 | Exceptional $66,161 |