Tlingit-Haida vs Romanian Householder Income Over 65 years
COMPARE
Tlingit-Haida
Romanian
Householder Income Over 65 years
Householder Income Over 65 years Comparison
Tlingit-Haida
Romanians
$62,922
HOUSEHOLDER INCOME OVER 65 YEARS
88.6/ 100
METRIC RATING
123rd/ 347
METRIC RANK
$64,142
HOUSEHOLDER INCOME OVER 65 YEARS
96.5/ 100
METRIC RATING
98th/ 347
METRIC RANK
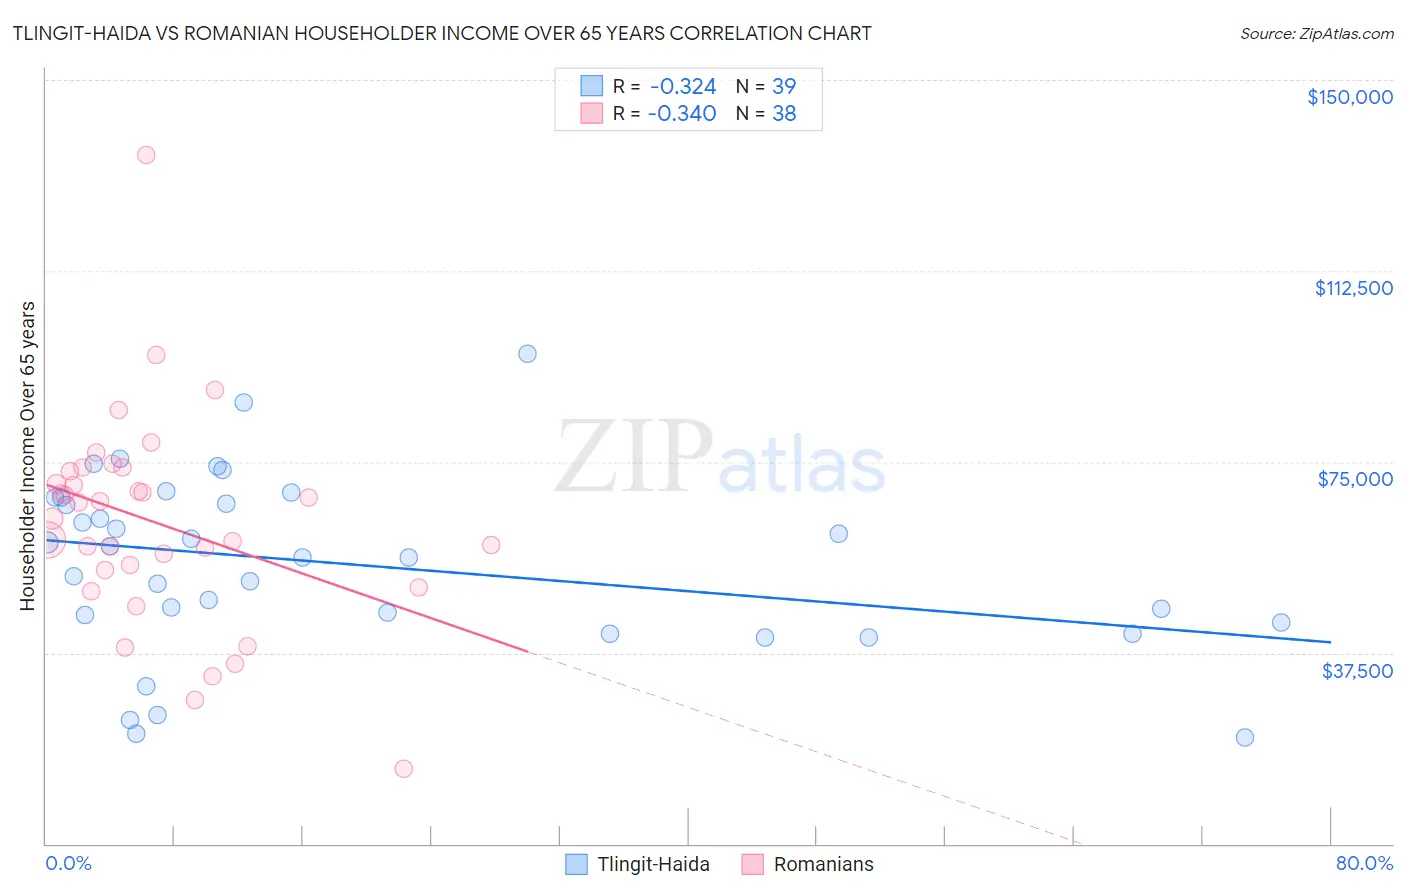
Tlingit-Haida vs Romanian Householder Income Over 65 years Correlation Chart
The statistical analysis conducted on geographies consisting of 60,750,081 people shows a mild negative correlation between the proportion of Tlingit-Haida and household income with householder over the age of 65 in the United States with a correlation coefficient (R) of -0.324 and weighted average of $62,922. Similarly, the statistical analysis conducted on geographies consisting of 376,856,051 people shows a mild negative correlation between the proportion of Romanians and household income with householder over the age of 65 in the United States with a correlation coefficient (R) of -0.340 and weighted average of $64,142, a difference of 1.9%.
Householder Income Over 65 years Correlation Summary
| Measurement | Tlingit-Haida | Romanian |
| Minimum | $20,833 | $14,625 |
| Maximum | $96,250 | $135,238 |
| Range | $75,417 | $120,613 |
| Mean | $54,963 | $62,942 |
| Median | $56,173 | $65,425 |
| Interquartile 25% (IQ1) | $43,571 | $53,666 |
| Interquartile 75% (IQ3) | $67,937 | $73,079 |
| Interquartile Range (IQR) | $24,366 | $19,413 |
| Standard Deviation (Sample) | $17,428 | $20,808 |
| Standard Deviation (Population) | $17,203 | $20,532 |
Similar Demographics by Householder Income Over 65 years
Demographics Similar to Tlingit-Haida by Householder Income Over 65 years
In terms of householder income over 65 years, the demographic groups most similar to Tlingit-Haida are Immigrants from Moldova ($62,939, a difference of 0.030%), Taiwanese ($62,894, a difference of 0.040%), Soviet Union ($62,848, a difference of 0.12%), Immigrants from Vietnam ($63,014, a difference of 0.15%), and Ukrainian ($63,032, a difference of 0.18%).
| Demographics | Rating | Rank | Householder Income Over 65 years |
| Guamanians/Chamorros | 91.1 /100 | #116 | Exceptional $63,187 |
| Immigrants | Croatia | 90.9 /100 | #117 | Exceptional $63,168 |
| Danes | 90.5 /100 | #118 | Exceptional $63,117 |
| Immigrants | Jordan | 89.8 /100 | #119 | Excellent $63,041 |
| Ukrainians | 89.7 /100 | #120 | Excellent $63,032 |
| Immigrants | Vietnam | 89.5 /100 | #121 | Excellent $63,014 |
| Immigrants | Moldova | 88.7 /100 | #122 | Excellent $62,939 |
| Tlingit-Haida | 88.6 /100 | #123 | Excellent $62,922 |
| Taiwanese | 88.3 /100 | #124 | Excellent $62,894 |
| Soviet Union | 87.8 /100 | #125 | Excellent $62,848 |
| Peruvians | 86.8 /100 | #126 | Excellent $62,766 |
| Swedes | 86.4 /100 | #127 | Excellent $62,736 |
| Aleuts | 86.1 /100 | #128 | Excellent $62,708 |
| Immigrants | Eastern Europe | 85.9 /100 | #129 | Excellent $62,693 |
| Basques | 85.4 /100 | #130 | Excellent $62,653 |
Demographics Similar to Romanians by Householder Income Over 65 years
In terms of householder income over 65 years, the demographic groups most similar to Romanians are Assyrian/Chaldean/Syriac ($64,108, a difference of 0.050%), Immigrants from South Eastern Asia ($64,089, a difference of 0.080%), Sri Lankan ($64,201, a difference of 0.090%), Immigrants from Italy ($64,065, a difference of 0.12%), and Immigrants from Hungary ($64,277, a difference of 0.21%).
| Demographics | Rating | Rank | Householder Income Over 65 years |
| Immigrants | Oceania | 97.4 /100 | #91 | Exceptional $64,416 |
| Immigrants | Bulgaria | 97.3 /100 | #92 | Exceptional $64,379 |
| Jordanians | 97.1 /100 | #93 | Exceptional $64,313 |
| Immigrants | Egypt | 97.0 /100 | #94 | Exceptional $64,299 |
| Immigrants | Latvia | 97.0 /100 | #95 | Exceptional $64,298 |
| Immigrants | Hungary | 97.0 /100 | #96 | Exceptional $64,277 |
| Sri Lankans | 96.7 /100 | #97 | Exceptional $64,201 |
| Romanians | 96.5 /100 | #98 | Exceptional $64,142 |
| Assyrians/Chaldeans/Syriacs | 96.4 /100 | #99 | Exceptional $64,108 |
| Immigrants | South Eastern Asia | 96.3 /100 | #100 | Exceptional $64,089 |
| Immigrants | Italy | 96.2 /100 | #101 | Exceptional $64,065 |
| Chileans | 95.8 /100 | #102 | Exceptional $63,957 |
| British | 95.7 /100 | #103 | Exceptional $63,940 |
| Immigrants | Cameroon | 95.6 /100 | #104 | Exceptional $63,907 |
| Italians | 95.5 /100 | #105 | Exceptional $63,885 |