Tlingit-Haida vs Finnish Householder Income Over 65 years
COMPARE
Tlingit-Haida
Finnish
Householder Income Over 65 years
Householder Income Over 65 years Comparison
Tlingit-Haida
Finns
$62,922
HOUSEHOLDER INCOME OVER 65 YEARS
88.6/ 100
METRIC RATING
123rd/ 347
METRIC RANK
$59,535
HOUSEHOLDER INCOME OVER 65 YEARS
18.2/ 100
METRIC RATING
202nd/ 347
METRIC RANK
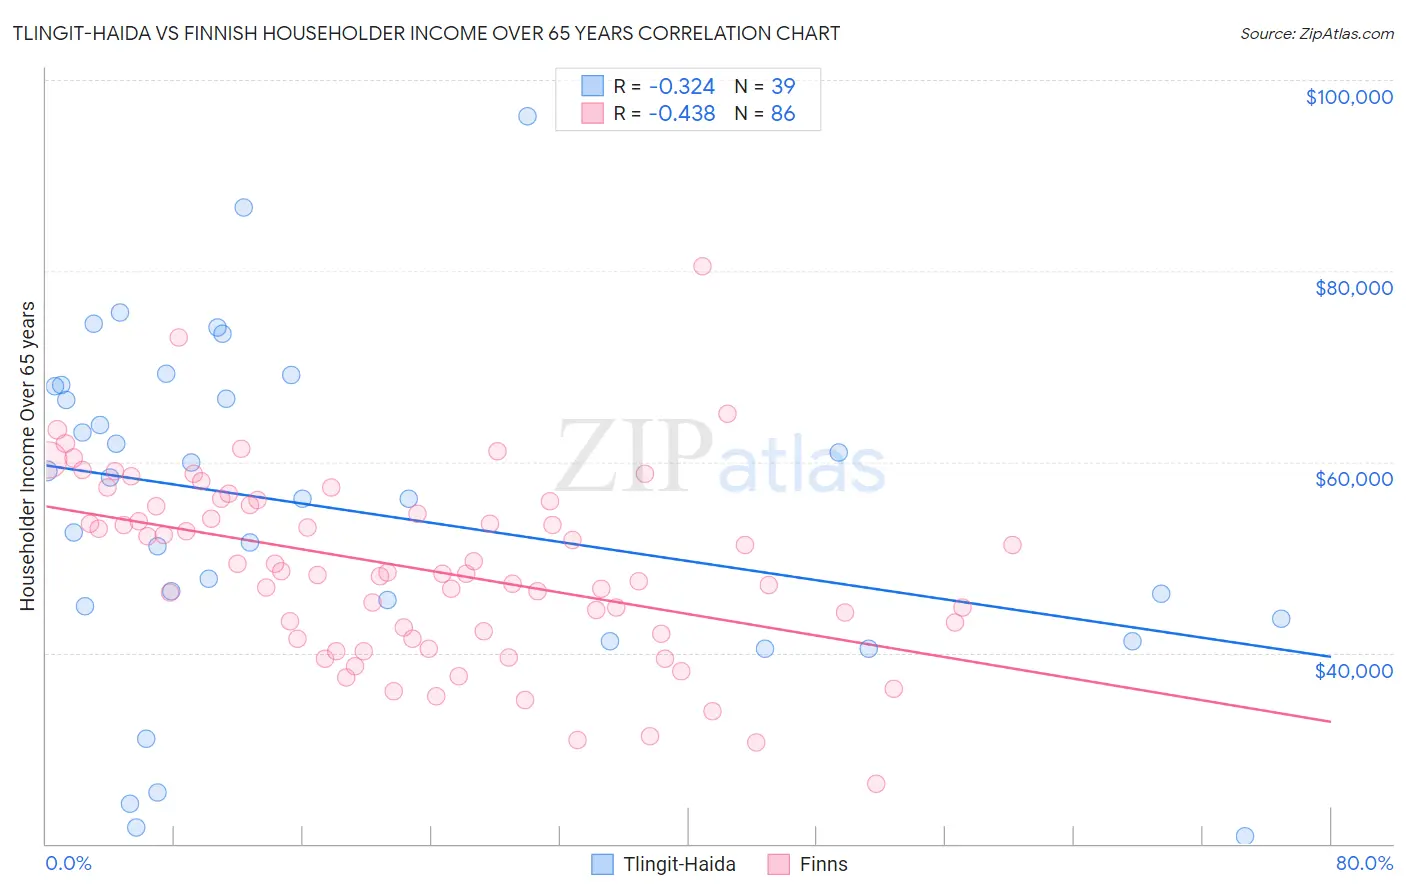
Tlingit-Haida vs Finnish Householder Income Over 65 years Correlation Chart
The statistical analysis conducted on geographies consisting of 60,750,081 people shows a mild negative correlation between the proportion of Tlingit-Haida and household income with householder over the age of 65 in the United States with a correlation coefficient (R) of -0.324 and weighted average of $62,922. Similarly, the statistical analysis conducted on geographies consisting of 403,493,749 people shows a moderate negative correlation between the proportion of Finns and household income with householder over the age of 65 in the United States with a correlation coefficient (R) of -0.438 and weighted average of $59,535, a difference of 5.7%.
Householder Income Over 65 years Correlation Summary
| Measurement | Tlingit-Haida | Finnish |
| Minimum | $20,833 | $26,250 |
| Maximum | $96,250 | $80,493 |
| Range | $75,417 | $54,243 |
| Mean | $54,963 | $48,855 |
| Median | $56,173 | $48,360 |
| Interquartile 25% (IQ1) | $43,571 | $41,947 |
| Interquartile 75% (IQ3) | $67,937 | $55,469 |
| Interquartile Range (IQR) | $24,366 | $13,523 |
| Standard Deviation (Sample) | $17,428 | $9,627 |
| Standard Deviation (Population) | $17,203 | $9,571 |
Similar Demographics by Householder Income Over 65 years
Demographics Similar to Tlingit-Haida by Householder Income Over 65 years
In terms of householder income over 65 years, the demographic groups most similar to Tlingit-Haida are Immigrants from Moldova ($62,939, a difference of 0.030%), Taiwanese ($62,894, a difference of 0.040%), Soviet Union ($62,848, a difference of 0.12%), Immigrants from Vietnam ($63,014, a difference of 0.15%), and Ukrainian ($63,032, a difference of 0.18%).
| Demographics | Rating | Rank | Householder Income Over 65 years |
| Guamanians/Chamorros | 91.1 /100 | #116 | Exceptional $63,187 |
| Immigrants | Croatia | 90.9 /100 | #117 | Exceptional $63,168 |
| Danes | 90.5 /100 | #118 | Exceptional $63,117 |
| Immigrants | Jordan | 89.8 /100 | #119 | Excellent $63,041 |
| Ukrainians | 89.7 /100 | #120 | Excellent $63,032 |
| Immigrants | Vietnam | 89.5 /100 | #121 | Excellent $63,014 |
| Immigrants | Moldova | 88.7 /100 | #122 | Excellent $62,939 |
| Tlingit-Haida | 88.6 /100 | #123 | Excellent $62,922 |
| Taiwanese | 88.3 /100 | #124 | Excellent $62,894 |
| Soviet Union | 87.8 /100 | #125 | Excellent $62,848 |
| Peruvians | 86.8 /100 | #126 | Excellent $62,766 |
| Swedes | 86.4 /100 | #127 | Excellent $62,736 |
| Aleuts | 86.1 /100 | #128 | Excellent $62,708 |
| Immigrants | Eastern Europe | 85.9 /100 | #129 | Excellent $62,693 |
| Basques | 85.4 /100 | #130 | Excellent $62,653 |
Demographics Similar to Finns by Householder Income Over 65 years
In terms of householder income over 65 years, the demographic groups most similar to Finns are Dutch ($59,539, a difference of 0.010%), Scotch-Irish ($59,447, a difference of 0.15%), Immigrants ($59,656, a difference of 0.20%), French ($59,656, a difference of 0.20%), and Moroccan ($59,683, a difference of 0.25%).
| Demographics | Rating | Rank | Householder Income Over 65 years |
| Immigrants | Iraq | 23.2 /100 | #195 | Fair $59,824 |
| Germans | 21.5 /100 | #196 | Fair $59,730 |
| Immigrants | Kenya | 21.1 /100 | #197 | Fair $59,710 |
| Moroccans | 20.7 /100 | #198 | Fair $59,683 |
| Immigrants | Immigrants | 20.2 /100 | #199 | Fair $59,656 |
| French | 20.2 /100 | #200 | Fair $59,656 |
| Dutch | 18.3 /100 | #201 | Poor $59,539 |
| Finns | 18.2 /100 | #202 | Poor $59,535 |
| Scotch-Irish | 16.9 /100 | #203 | Poor $59,447 |
| Arapaho | 16.0 /100 | #204 | Poor $59,383 |
| Immigrants | Sudan | 14.2 /100 | #205 | Poor $59,248 |
| Immigrants | South America | 13.0 /100 | #206 | Poor $59,151 |
| Salvadorans | 12.9 /100 | #207 | Poor $59,141 |
| Uruguayans | 12.3 /100 | #208 | Poor $59,090 |
| Slovaks | 11.7 /100 | #209 | Poor $59,039 |