Tlingit-Haida vs Marshallese Householder Income Over 65 years
COMPARE
Tlingit-Haida
Marshallese
Householder Income Over 65 years
Householder Income Over 65 years Comparison
Tlingit-Haida
Marshallese
$62,922
HOUSEHOLDER INCOME OVER 65 YEARS
88.6/ 100
METRIC RATING
123rd/ 347
METRIC RANK
$65,874
HOUSEHOLDER INCOME OVER 65 YEARS
99.4/ 100
METRIC RATING
63rd/ 347
METRIC RANK
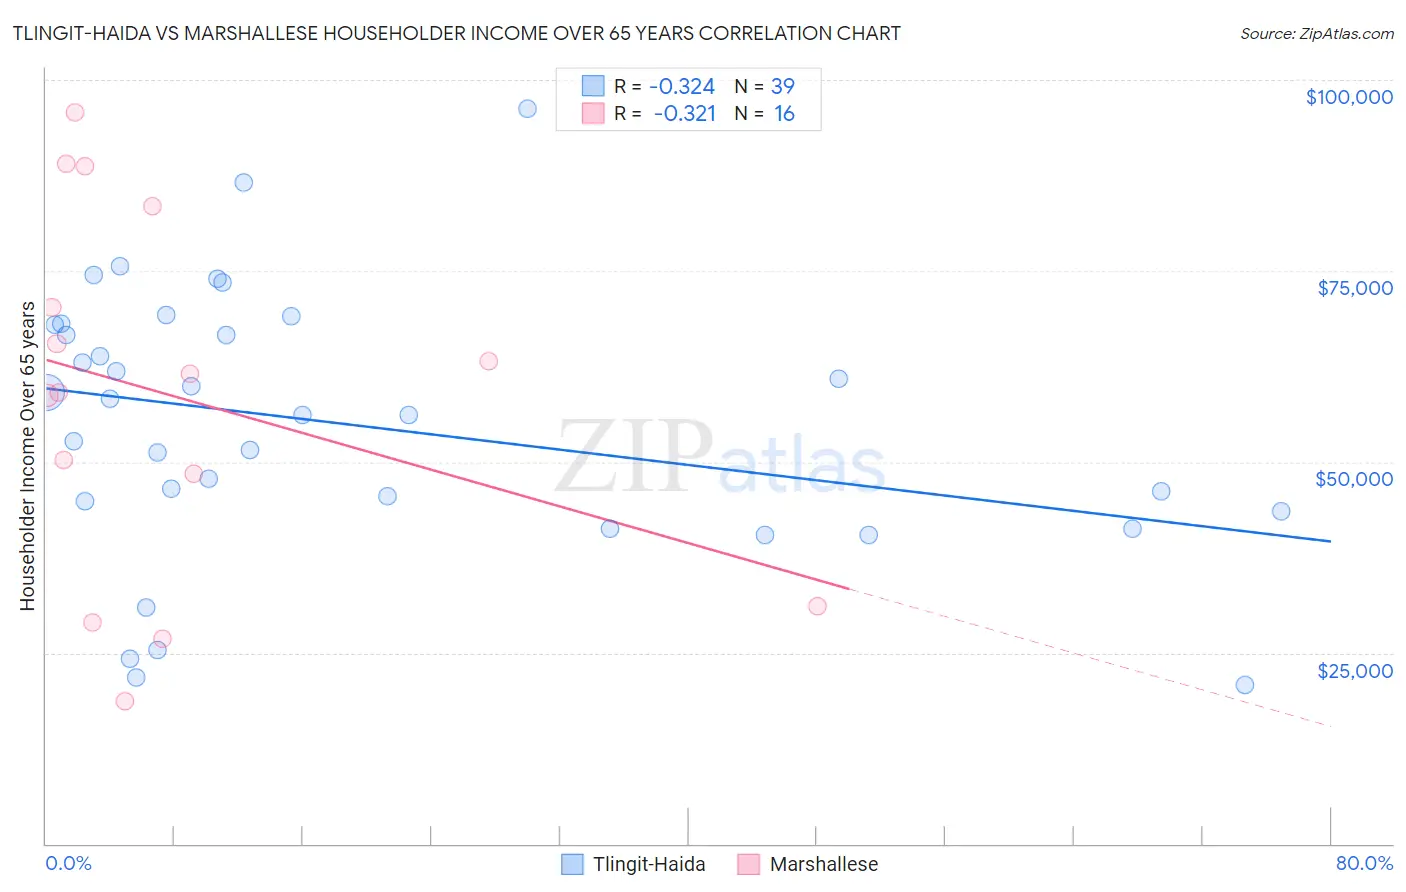
Tlingit-Haida vs Marshallese Householder Income Over 65 years Correlation Chart
The statistical analysis conducted on geographies consisting of 60,750,081 people shows a mild negative correlation between the proportion of Tlingit-Haida and household income with householder over the age of 65 in the United States with a correlation coefficient (R) of -0.324 and weighted average of $62,922. Similarly, the statistical analysis conducted on geographies consisting of 14,755,394 people shows a mild negative correlation between the proportion of Marshallese and household income with householder over the age of 65 in the United States with a correlation coefficient (R) of -0.321 and weighted average of $65,874, a difference of 4.7%.
Householder Income Over 65 years Correlation Summary
| Measurement | Tlingit-Haida | Marshallese |
| Minimum | $20,833 | $18,720 |
| Maximum | $96,250 | $95,763 |
| Range | $75,417 | $77,043 |
| Mean | $54,963 | $58,723 |
| Median | $56,173 | $60,305 |
| Interquartile 25% (IQ1) | $43,571 | $39,754 |
| Interquartile 75% (IQ3) | $67,937 | $76,864 |
| Interquartile Range (IQR) | $24,366 | $37,109 |
| Standard Deviation (Sample) | $17,428 | $23,740 |
| Standard Deviation (Population) | $17,203 | $22,986 |
Similar Demographics by Householder Income Over 65 years
Demographics Similar to Tlingit-Haida by Householder Income Over 65 years
In terms of householder income over 65 years, the demographic groups most similar to Tlingit-Haida are Immigrants from Moldova ($62,939, a difference of 0.030%), Taiwanese ($62,894, a difference of 0.040%), Soviet Union ($62,848, a difference of 0.12%), Immigrants from Vietnam ($63,014, a difference of 0.15%), and Ukrainian ($63,032, a difference of 0.18%).
| Demographics | Rating | Rank | Householder Income Over 65 years |
| Guamanians/Chamorros | 91.1 /100 | #116 | Exceptional $63,187 |
| Immigrants | Croatia | 90.9 /100 | #117 | Exceptional $63,168 |
| Danes | 90.5 /100 | #118 | Exceptional $63,117 |
| Immigrants | Jordan | 89.8 /100 | #119 | Excellent $63,041 |
| Ukrainians | 89.7 /100 | #120 | Excellent $63,032 |
| Immigrants | Vietnam | 89.5 /100 | #121 | Excellent $63,014 |
| Immigrants | Moldova | 88.7 /100 | #122 | Excellent $62,939 |
| Tlingit-Haida | 88.6 /100 | #123 | Excellent $62,922 |
| Taiwanese | 88.3 /100 | #124 | Excellent $62,894 |
| Soviet Union | 87.8 /100 | #125 | Excellent $62,848 |
| Peruvians | 86.8 /100 | #126 | Excellent $62,766 |
| Swedes | 86.4 /100 | #127 | Excellent $62,736 |
| Aleuts | 86.1 /100 | #128 | Excellent $62,708 |
| Immigrants | Eastern Europe | 85.9 /100 | #129 | Excellent $62,693 |
| Basques | 85.4 /100 | #130 | Excellent $62,653 |
Demographics Similar to Marshallese by Householder Income Over 65 years
In terms of householder income over 65 years, the demographic groups most similar to Marshallese are Zimbabwean ($65,854, a difference of 0.030%), Immigrants from Sierra Leone ($66,009, a difference of 0.21%), Maltese ($66,027, a difference of 0.23%), Immigrants from England ($65,715, a difference of 0.24%), and Immigrants from Lithuania ($66,087, a difference of 0.32%).
| Demographics | Rating | Rank | Householder Income Over 65 years |
| Laotians | 99.6 /100 | #56 | Exceptional $66,306 |
| Bulgarians | 99.6 /100 | #57 | Exceptional $66,236 |
| Immigrants | Philippines | 99.6 /100 | #58 | Exceptional $66,161 |
| Immigrants | Norway | 99.5 /100 | #59 | Exceptional $66,118 |
| Immigrants | Lithuania | 99.5 /100 | #60 | Exceptional $66,087 |
| Maltese | 99.5 /100 | #61 | Exceptional $66,027 |
| Immigrants | Sierra Leone | 99.5 /100 | #62 | Exceptional $66,009 |
| Marshallese | 99.4 /100 | #63 | Exceptional $65,874 |
| Zimbabweans | 99.4 /100 | #64 | Exceptional $65,854 |
| Immigrants | England | 99.3 /100 | #65 | Exceptional $65,715 |
| South Africans | 99.3 /100 | #66 | Exceptional $65,652 |
| Immigrants | Malaysia | 99.1 /100 | #67 | Exceptional $65,497 |
| Egyptians | 99.1 /100 | #68 | Exceptional $65,441 |
| Samoans | 99.1 /100 | #69 | Exceptional $65,427 |
| Mongolians | 99.0 /100 | #70 | Exceptional $65,326 |