Greek vs Israeli Householder Income Over 65 years
COMPARE
Greek
Israeli
Householder Income Over 65 years
Householder Income Over 65 years Comparison
Greeks
Israelis
$65,306
HOUSEHOLDER INCOME OVER 65 YEARS
98.9/ 100
METRIC RATING
71st/ 347
METRIC RANK
$66,636
HOUSEHOLDER INCOME OVER 65 YEARS
99.7/ 100
METRIC RATING
51st/ 347
METRIC RANK
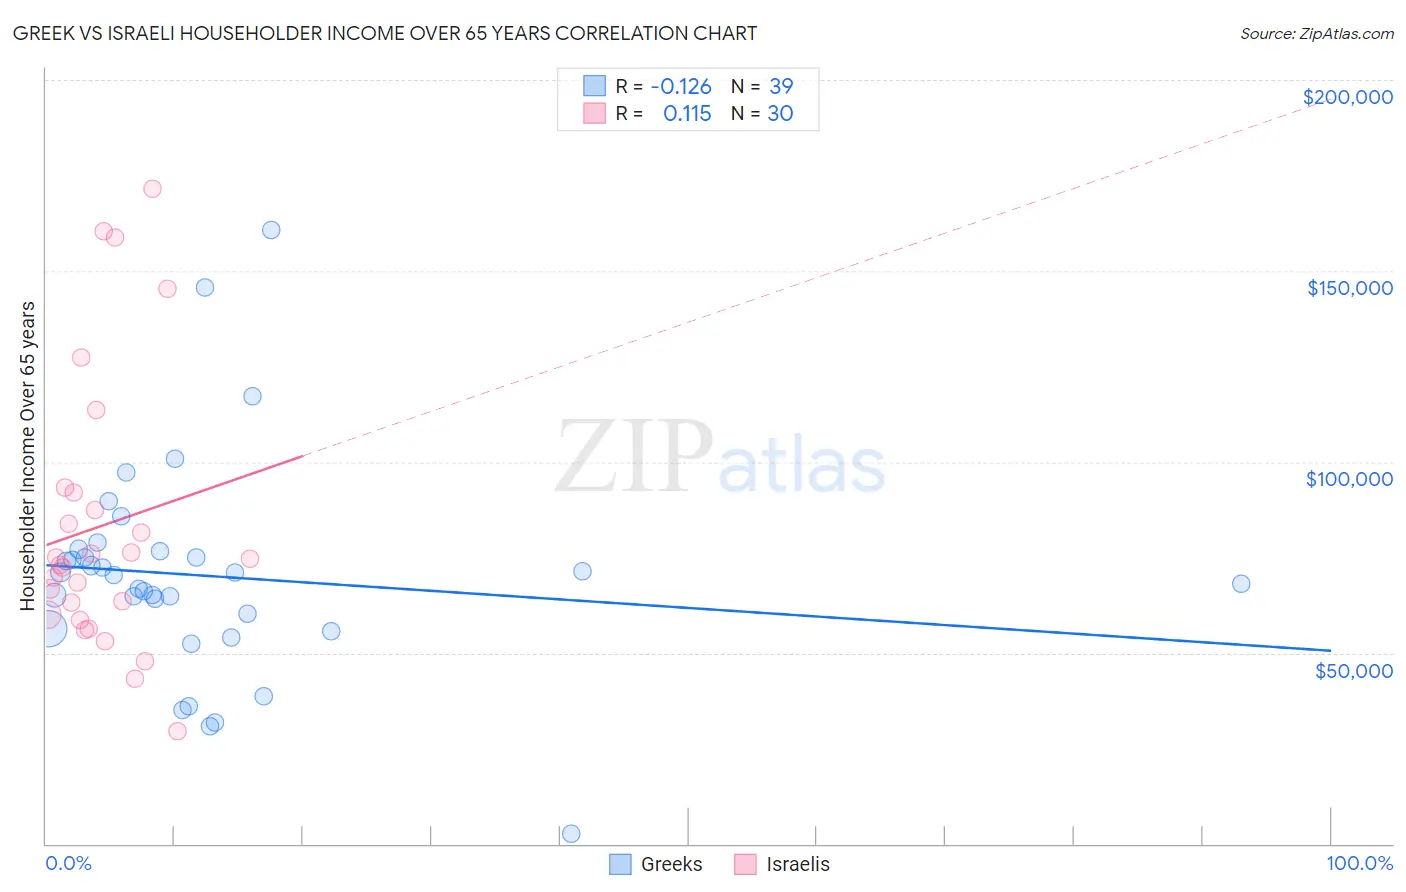
Greek vs Israeli Householder Income Over 65 years Correlation Chart
The statistical analysis conducted on geographies consisting of 480,541,724 people shows a poor negative correlation between the proportion of Greeks and household income with householder over the age of 65 in the United States with a correlation coefficient (R) of -0.126 and weighted average of $65,306. Similarly, the statistical analysis conducted on geographies consisting of 210,595,359 people shows a poor positive correlation between the proportion of Israelis and household income with householder over the age of 65 in the United States with a correlation coefficient (R) of 0.115 and weighted average of $66,636, a difference of 2.0%.
Householder Income Over 65 years Correlation Summary
| Measurement | Greek | Israeli |
| Minimum | $2,499 | $29,457 |
| Maximum | $160,774 | $171,563 |
| Range | $158,275 | $142,106 |
| Mean | $70,156 | $83,272 |
| Median | $70,510 | $73,731 |
| Interquartile 25% (IQ1) | $56,429 | $59,859 |
| Interquartile 75% (IQ3) | $76,518 | $92,033 |
| Interquartile Range (IQR) | $20,089 | $32,174 |
| Standard Deviation (Sample) | $28,523 | $36,038 |
| Standard Deviation (Population) | $28,155 | $35,432 |
Demographics Similar to Greeks and Israelis by Householder Income Over 65 years
In terms of householder income over 65 years, the demographic groups most similar to Greeks are Mongolian ($65,326, a difference of 0.030%), Samoan ($65,427, a difference of 0.19%), Egyptian ($65,441, a difference of 0.21%), Immigrants from Malaysia ($65,497, a difference of 0.29%), and South African ($65,652, a difference of 0.53%). Similarly, the demographic groups most similar to Israelis are Immigrants from Scotland ($66,620, a difference of 0.020%), Immigrants from Pakistan ($66,617, a difference of 0.030%), Immigrants from Netherlands ($66,463, a difference of 0.26%), Immigrants from Czechoslovakia ($66,376, a difference of 0.39%), and Laotian ($66,306, a difference of 0.50%).
| Demographics | Rating | Rank | Householder Income Over 65 years |
| Israelis | 99.7 /100 | #51 | Exceptional $66,636 |
| Immigrants | Scotland | 99.7 /100 | #52 | Exceptional $66,620 |
| Immigrants | Pakistan | 99.7 /100 | #53 | Exceptional $66,617 |
| Immigrants | Netherlands | 99.7 /100 | #54 | Exceptional $66,463 |
| Immigrants | Czechoslovakia | 99.7 /100 | #55 | Exceptional $66,376 |
| Laotians | 99.6 /100 | #56 | Exceptional $66,306 |
| Bulgarians | 99.6 /100 | #57 | Exceptional $66,236 |
| Immigrants | Philippines | 99.6 /100 | #58 | Exceptional $66,161 |
| Immigrants | Norway | 99.5 /100 | #59 | Exceptional $66,118 |
| Immigrants | Lithuania | 99.5 /100 | #60 | Exceptional $66,087 |
| Maltese | 99.5 /100 | #61 | Exceptional $66,027 |
| Immigrants | Sierra Leone | 99.5 /100 | #62 | Exceptional $66,009 |
| Marshallese | 99.4 /100 | #63 | Exceptional $65,874 |
| Zimbabweans | 99.4 /100 | #64 | Exceptional $65,854 |
| Immigrants | England | 99.3 /100 | #65 | Exceptional $65,715 |
| South Africans | 99.3 /100 | #66 | Exceptional $65,652 |
| Immigrants | Malaysia | 99.1 /100 | #67 | Exceptional $65,497 |
| Egyptians | 99.1 /100 | #68 | Exceptional $65,441 |
| Samoans | 99.1 /100 | #69 | Exceptional $65,427 |
| Mongolians | 99.0 /100 | #70 | Exceptional $65,326 |
| Greeks | 98.9 /100 | #71 | Exceptional $65,306 |