Swiss vs Ecuadorian 2 or more Vehicles in Household
COMPARE
Swiss
Ecuadorian
2 or more Vehicles in Household
2 or more Vehicles in Household Comparison
Swiss
Ecuadorians
61.0%
2 OR MORE VEHICLES IN HOUSEHOLD
100.0/ 100
METRIC RATING
22nd/ 347
METRIC RANK
42.0%
2 OR MORE VEHICLES IN HOUSEHOLD
0.0/ 100
METRIC RATING
329th/ 347
METRIC RANK
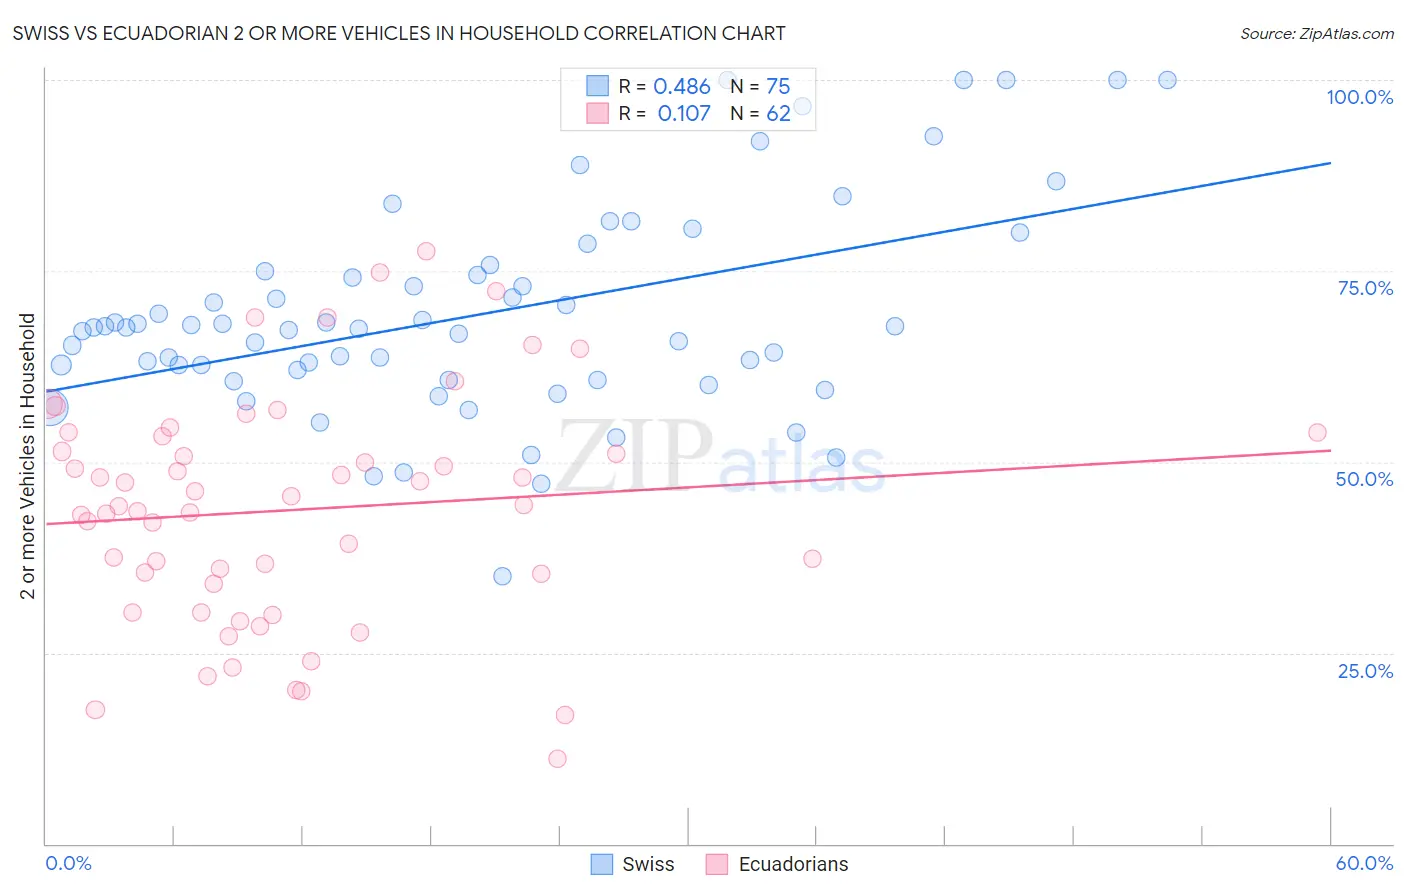
Swiss vs Ecuadorian 2 or more Vehicles in Household Correlation Chart
The statistical analysis conducted on geographies consisting of 464,799,641 people shows a moderate positive correlation between the proportion of Swiss and percentage of households with 2 or more vehicles available in the United States with a correlation coefficient (R) of 0.486 and weighted average of 61.0%. Similarly, the statistical analysis conducted on geographies consisting of 317,664,097 people shows a poor positive correlation between the proportion of Ecuadorians and percentage of households with 2 or more vehicles available in the United States with a correlation coefficient (R) of 0.107 and weighted average of 42.0%, a difference of 45.3%.
2 or more Vehicles in Household Correlation Summary
| Measurement | Swiss | Ecuadorian |
| Minimum | 35.0% | 11.1% |
| Maximum | 100.0% | 77.6% |
| Range | 65.0% | 66.5% |
| Mean | 69.3% | 43.7% |
| Median | 67.5% | 44.3% |
| Interquartile 25% (IQ1) | 60.8% | 34.1% |
| Interquartile 75% (IQ3) | 75.0% | 53.3% |
| Interquartile Range (IQR) | 14.2% | 19.3% |
| Standard Deviation (Sample) | 13.7% | 15.0% |
| Standard Deviation (Population) | 13.6% | 14.9% |
Similar Demographics by 2 or more Vehicles in Household
Demographics Similar to Swiss by 2 or more Vehicles in Household
In terms of 2 or more vehicles in household, the demographic groups most similar to Swiss are Korean (61.0%, a difference of 0.040%), Scotch-Irish (60.9%, a difference of 0.040%), Immigrants from Vietnam (60.9%, a difference of 0.070%), Sri Lankan (61.0%, a difference of 0.080%), and White/Caucasian (60.8%, a difference of 0.23%).
| Demographics | Rating | Rank | 2 or more Vehicles in Household |
| Nepalese | 100.0 /100 | #15 | Exceptional 61.4% |
| Native Hawaiians | 100.0 /100 | #16 | Exceptional 61.4% |
| Basques | 100.0 /100 | #17 | Exceptional 61.4% |
| Europeans | 100.0 /100 | #18 | Exceptional 61.4% |
| Scottish | 100.0 /100 | #19 | Exceptional 61.2% |
| Sri Lankans | 100.0 /100 | #20 | Exceptional 61.0% |
| Koreans | 100.0 /100 | #21 | Exceptional 61.0% |
| Swiss | 100.0 /100 | #22 | Exceptional 61.0% |
| Scotch-Irish | 100.0 /100 | #23 | Exceptional 60.9% |
| Immigrants | Vietnam | 100.0 /100 | #24 | Exceptional 60.9% |
| Whites/Caucasians | 100.0 /100 | #25 | Exceptional 60.8% |
| Welsh | 100.0 /100 | #26 | Exceptional 60.8% |
| Assyrians/Chaldeans/Syriacs | 100.0 /100 | #27 | Exceptional 60.5% |
| Guamanians/Chamorros | 100.0 /100 | #28 | Exceptional 60.5% |
| Hawaiians | 100.0 /100 | #29 | Exceptional 60.4% |
Demographics Similar to Ecuadorians by 2 or more Vehicles in Household
In terms of 2 or more vehicles in household, the demographic groups most similar to Ecuadorians are Immigrants from Dominica (41.6%, a difference of 0.82%), Inupiat (42.6%, a difference of 1.6%), West Indian (41.3%, a difference of 1.7%), Immigrants from Yemen (42.8%, a difference of 2.1%), and Immigrants from Senegal (43.0%, a difference of 2.5%).
| Demographics | Rating | Rank | 2 or more Vehicles in Household |
| Senegalese | 0.0 /100 | #322 | Tragic 44.2% |
| Immigrants | Caribbean | 0.0 /100 | #323 | Tragic 44.2% |
| Immigrants | Cabo Verde | 0.0 /100 | #324 | Tragic 43.3% |
| Immigrants | West Indies | 0.0 /100 | #325 | Tragic 43.1% |
| Immigrants | Senegal | 0.0 /100 | #326 | Tragic 43.0% |
| Immigrants | Yemen | 0.0 /100 | #327 | Tragic 42.8% |
| Inupiat | 0.0 /100 | #328 | Tragic 42.6% |
| Ecuadorians | 0.0 /100 | #329 | Tragic 42.0% |
| Immigrants | Dominica | 0.0 /100 | #330 | Tragic 41.6% |
| West Indians | 0.0 /100 | #331 | Tragic 41.3% |
| Trinidadians and Tobagonians | 0.0 /100 | #332 | Tragic 40.9% |
| Immigrants | Ecuador | 0.0 /100 | #333 | Tragic 40.5% |
| Immigrants | Trinidad and Tobago | 0.0 /100 | #334 | Tragic 40.3% |
| Immigrants | Bangladesh | 0.0 /100 | #335 | Tragic 38.8% |
| Vietnamese | 0.0 /100 | #336 | Tragic 38.5% |