South American vs Greek Wage/Income Gap
COMPARE
South American
Greek
Wage/Income Gap
Wage/Income Gap Comparison
South Americans
Greeks
25.0%
WAGE/INCOME GAP
85.2/ 100
METRIC RATING
146th/ 347
METRIC RANK
28.2%
WAGE/INCOME GAP
0.3/ 100
METRIC RATING
294th/ 347
METRIC RANK
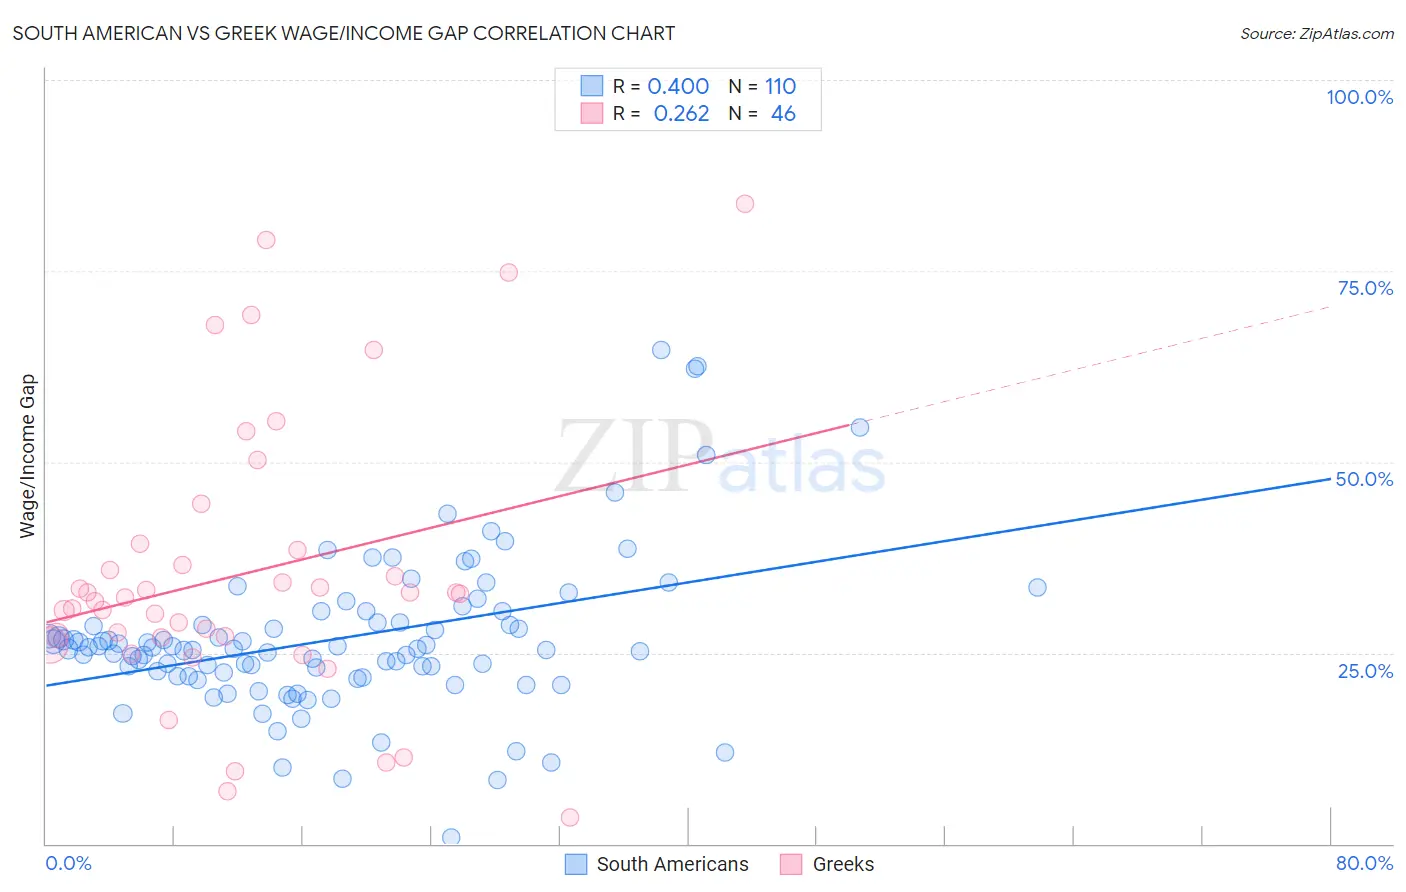
South American vs Greek Wage/Income Gap Correlation Chart
The statistical analysis conducted on geographies consisting of 493,539,614 people shows a mild positive correlation between the proportion of South Americans and wage/income gap percentage in the United States with a correlation coefficient (R) of 0.400 and weighted average of 25.0%. Similarly, the statistical analysis conducted on geographies consisting of 482,094,899 people shows a weak positive correlation between the proportion of Greeks and wage/income gap percentage in the United States with a correlation coefficient (R) of 0.262 and weighted average of 28.2%, a difference of 12.8%.
Wage/Income Gap Correlation Summary
| Measurement | South American | Greek |
| Minimum | 0.78% | 3.5% |
| Maximum | 64.7% | 83.8% |
| Range | 63.9% | 80.3% |
| Mean | 26.9% | 35.4% |
| Median | 25.5% | 32.4% |
| Interquartile 25% (IQ1) | 22.0% | 27.0% |
| Interquartile 75% (IQ3) | 29.0% | 38.5% |
| Interquartile Range (IQR) | 7.0% | 11.5% |
| Standard Deviation (Sample) | 10.2% | 18.3% |
| Standard Deviation (Population) | 10.1% | 18.1% |
Similar Demographics by Wage/Income Gap
Demographics Similar to South Americans by Wage/Income Gap
In terms of wage/income gap, the demographic groups most similar to South Americans are Comanche (25.0%, a difference of 0.0%), Malaysian (25.0%, a difference of 0.030%), Iroquois (25.1%, a difference of 0.16%), Chippewa (25.0%, a difference of 0.24%), and Immigrants from Peru (25.1%, a difference of 0.31%).
| Demographics | Rating | Rank | Wage/Income Gap |
| Hispanics or Latinos | 89.5 /100 | #139 | Excellent 24.9% |
| Immigrants | Nepal | 89.3 /100 | #140 | Excellent 24.9% |
| Hawaiians | 89.3 /100 | #141 | Excellent 24.9% |
| Afghans | 88.1 /100 | #142 | Excellent 24.9% |
| Immigrants | Uganda | 88.0 /100 | #143 | Excellent 24.9% |
| Chippewa | 86.9 /100 | #144 | Excellent 25.0% |
| Comanche | 85.2 /100 | #145 | Excellent 25.0% |
| South Americans | 85.2 /100 | #146 | Excellent 25.0% |
| Malaysians | 84.9 /100 | #147 | Excellent 25.0% |
| Iroquois | 83.9 /100 | #148 | Excellent 25.1% |
| Immigrants | Peru | 82.6 /100 | #149 | Excellent 25.1% |
| Immigrants | Immigrants | 82.3 /100 | #150 | Excellent 25.1% |
| Taiwanese | 81.6 /100 | #151 | Excellent 25.1% |
| Uruguayans | 81.3 /100 | #152 | Excellent 25.2% |
| Blackfeet | 78.1 /100 | #153 | Good 25.2% |
Demographics Similar to Greeks by Wage/Income Gap
In terms of wage/income gap, the demographic groups most similar to Greeks are Immigrants from Israel (28.2%, a difference of 0.020%), Immigrants from Australia (28.2%, a difference of 0.13%), Slovene (28.3%, a difference of 0.13%), Northern European (28.3%, a difference of 0.13%), and Czechoslovakian (28.2%, a difference of 0.19%).
| Demographics | Rating | Rank | Wage/Income Gap |
| Okinawans | 0.4 /100 | #287 | Tragic 28.1% |
| Choctaw | 0.4 /100 | #288 | Tragic 28.1% |
| Canadians | 0.3 /100 | #289 | Tragic 28.1% |
| Australians | 0.3 /100 | #290 | Tragic 28.2% |
| Czechoslovakians | 0.3 /100 | #291 | Tragic 28.2% |
| Immigrants | Australia | 0.3 /100 | #292 | Tragic 28.2% |
| Immigrants | Israel | 0.3 /100 | #293 | Tragic 28.2% |
| Greeks | 0.3 /100 | #294 | Tragic 28.2% |
| Slovenes | 0.3 /100 | #295 | Tragic 28.3% |
| Northern Europeans | 0.3 /100 | #296 | Tragic 28.3% |
| Immigrants | North America | 0.2 /100 | #297 | Tragic 28.4% |
| Austrians | 0.2 /100 | #298 | Tragic 28.4% |
| Immigrants | North Macedonia | 0.2 /100 | #299 | Tragic 28.4% |
| Immigrants | Northern Europe | 0.2 /100 | #300 | Tragic 28.5% |
| Immigrants | Canada | 0.2 /100 | #301 | Tragic 28.5% |