South American vs Spanish Wage/Income Gap
COMPARE
South American
Spanish
Wage/Income Gap
Wage/Income Gap Comparison
South Americans
Spanish
25.0%
WAGE/INCOME GAP
85.2/ 100
METRIC RATING
146th/ 347
METRIC RANK
27.1%
WAGE/INCOME GAP
3.6/ 100
METRIC RATING
243rd/ 347
METRIC RANK
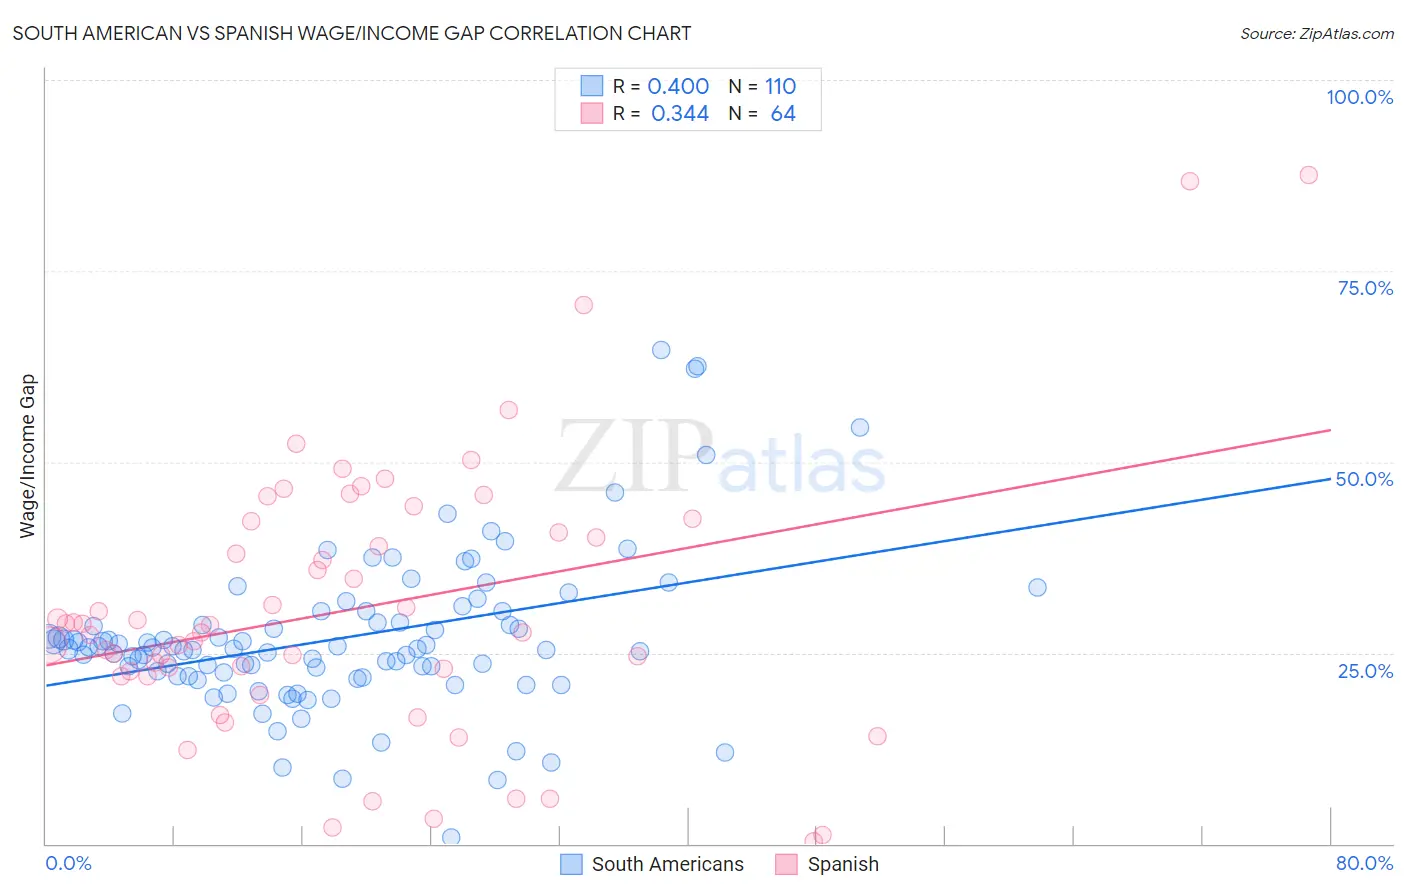
South American vs Spanish Wage/Income Gap Correlation Chart
The statistical analysis conducted on geographies consisting of 493,539,614 people shows a mild positive correlation between the proportion of South Americans and wage/income gap percentage in the United States with a correlation coefficient (R) of 0.400 and weighted average of 25.0%. Similarly, the statistical analysis conducted on geographies consisting of 421,731,243 people shows a mild positive correlation between the proportion of Spanish and wage/income gap percentage in the United States with a correlation coefficient (R) of 0.344 and weighted average of 27.1%, a difference of 8.4%.
Wage/Income Gap Correlation Summary
| Measurement | South American | Spanish |
| Minimum | 0.78% | 0.38% |
| Maximum | 64.7% | 87.5% |
| Range | 63.9% | 87.2% |
| Mean | 26.9% | 30.8% |
| Median | 25.5% | 28.1% |
| Interquartile 25% (IQ1) | 22.0% | 22.3% |
| Interquartile 75% (IQ3) | 29.0% | 41.5% |
| Interquartile Range (IQR) | 7.0% | 19.1% |
| Standard Deviation (Sample) | 10.2% | 17.7% |
| Standard Deviation (Population) | 10.1% | 17.6% |
Similar Demographics by Wage/Income Gap
Demographics Similar to South Americans by Wage/Income Gap
In terms of wage/income gap, the demographic groups most similar to South Americans are Comanche (25.0%, a difference of 0.0%), Malaysian (25.0%, a difference of 0.030%), Iroquois (25.1%, a difference of 0.16%), Chippewa (25.0%, a difference of 0.24%), and Immigrants from Peru (25.1%, a difference of 0.31%).
| Demographics | Rating | Rank | Wage/Income Gap |
| Hispanics or Latinos | 89.5 /100 | #139 | Excellent 24.9% |
| Immigrants | Nepal | 89.3 /100 | #140 | Excellent 24.9% |
| Hawaiians | 89.3 /100 | #141 | Excellent 24.9% |
| Afghans | 88.1 /100 | #142 | Excellent 24.9% |
| Immigrants | Uganda | 88.0 /100 | #143 | Excellent 24.9% |
| Chippewa | 86.9 /100 | #144 | Excellent 25.0% |
| Comanche | 85.2 /100 | #145 | Excellent 25.0% |
| South Americans | 85.2 /100 | #146 | Excellent 25.0% |
| Malaysians | 84.9 /100 | #147 | Excellent 25.0% |
| Iroquois | 83.9 /100 | #148 | Excellent 25.1% |
| Immigrants | Peru | 82.6 /100 | #149 | Excellent 25.1% |
| Immigrants | Immigrants | 82.3 /100 | #150 | Excellent 25.1% |
| Taiwanese | 81.6 /100 | #151 | Excellent 25.1% |
| Uruguayans | 81.3 /100 | #152 | Excellent 25.2% |
| Blackfeet | 78.1 /100 | #153 | Good 25.2% |
Demographics Similar to Spanish by Wage/Income Gap
In terms of wage/income gap, the demographic groups most similar to Spanish are Immigrants from Sri Lanka (27.1%, a difference of 0.010%), Creek (27.1%, a difference of 0.060%), Chickasaw (27.2%, a difference of 0.070%), Immigrants from Europe (27.1%, a difference of 0.080%), and Immigrants from the Azores (27.2%, a difference of 0.090%).
| Demographics | Rating | Rank | Wage/Income Gap |
| Immigrants | Romania | 4.8 /100 | #236 | Tragic 27.0% |
| Immigrants | Eastern Asia | 4.4 /100 | #237 | Tragic 27.1% |
| Osage | 4.4 /100 | #238 | Tragic 27.1% |
| Estonians | 4.3 /100 | #239 | Tragic 27.1% |
| Immigrants | Europe | 3.8 /100 | #240 | Tragic 27.1% |
| Creek | 3.8 /100 | #241 | Tragic 27.1% |
| Immigrants | Sri Lanka | 3.7 /100 | #242 | Tragic 27.1% |
| Spanish | 3.6 /100 | #243 | Tragic 27.1% |
| Chickasaw | 3.5 /100 | #244 | Tragic 27.2% |
| Immigrants | Azores | 3.5 /100 | #245 | Tragic 27.2% |
| Immigrants | Nonimmigrants | 3.3 /100 | #246 | Tragic 27.2% |
| Celtics | 2.8 /100 | #247 | Tragic 27.3% |
| Cypriots | 2.8 /100 | #248 | Tragic 27.3% |
| Carpatho Rusyns | 2.7 /100 | #249 | Tragic 27.3% |
| Immigrants | Czechoslovakia | 2.7 /100 | #250 | Tragic 27.3% |