Belgian vs Greek Wage/Income Gap
COMPARE
Belgian
Greek
Wage/Income Gap
Wage/Income Gap Comparison
Belgians
Greeks
28.8%
WAGE/INCOME GAP
0.1/ 100
METRIC RATING
317th/ 347
METRIC RANK
28.2%
WAGE/INCOME GAP
0.3/ 100
METRIC RATING
294th/ 347
METRIC RANK
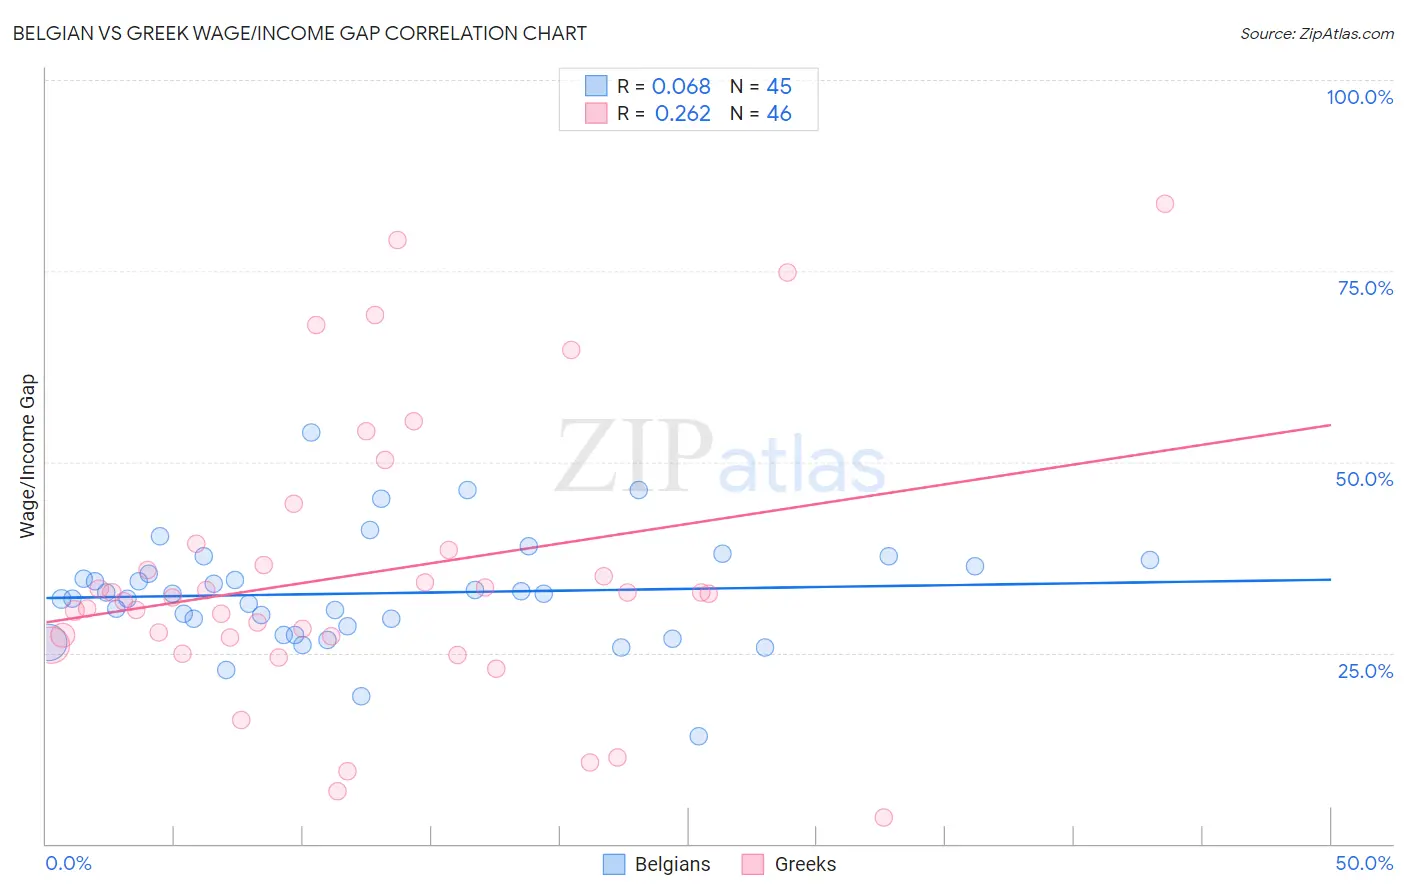
Belgian vs Greek Wage/Income Gap Correlation Chart
The statistical analysis conducted on geographies consisting of 355,768,558 people shows a slight positive correlation between the proportion of Belgians and wage/income gap percentage in the United States with a correlation coefficient (R) of 0.068 and weighted average of 28.8%. Similarly, the statistical analysis conducted on geographies consisting of 482,094,899 people shows a weak positive correlation between the proportion of Greeks and wage/income gap percentage in the United States with a correlation coefficient (R) of 0.262 and weighted average of 28.2%, a difference of 1.9%.
Wage/Income Gap Correlation Summary
| Measurement | Belgian | Greek |
| Minimum | 14.1% | 3.5% |
| Maximum | 53.8% | 83.8% |
| Range | 39.7% | 80.3% |
| Mean | 32.8% | 35.4% |
| Median | 32.7% | 32.4% |
| Interquartile 25% (IQ1) | 27.9% | 27.0% |
| Interquartile 75% (IQ3) | 36.7% | 38.5% |
| Interquartile Range (IQR) | 8.8% | 11.5% |
| Standard Deviation (Sample) | 7.2% | 18.3% |
| Standard Deviation (Population) | 7.1% | 18.1% |
Similar Demographics by Wage/Income Gap
Demographics Similar to Belgians by Wage/Income Gap
In terms of wage/income gap, the demographic groups most similar to Belgians are Basque (28.8%, a difference of 0.050%), Lithuanian (28.7%, a difference of 0.11%), Maltese (28.7%, a difference of 0.12%), Immigrants from Scotland (28.7%, a difference of 0.17%), and French (28.7%, a difference of 0.32%).
| Demographics | Rating | Rank | Wage/Income Gap |
| Finns | 0.1 /100 | #310 | Tragic 28.6% |
| Immigrants | Lithuania | 0.1 /100 | #311 | Tragic 28.6% |
| Eastern Europeans | 0.1 /100 | #312 | Tragic 28.6% |
| French | 0.1 /100 | #313 | Tragic 28.7% |
| Immigrants | Scotland | 0.1 /100 | #314 | Tragic 28.7% |
| Maltese | 0.1 /100 | #315 | Tragic 28.7% |
| Lithuanians | 0.1 /100 | #316 | Tragic 28.7% |
| Belgians | 0.1 /100 | #317 | Tragic 28.8% |
| Basques | 0.1 /100 | #318 | Tragic 28.8% |
| Slovaks | 0.1 /100 | #319 | Tragic 28.9% |
| British | 0.1 /100 | #320 | Tragic 28.9% |
| Welsh | 0.1 /100 | #321 | Tragic 28.9% |
| Immigrants | Singapore | 0.1 /100 | #322 | Tragic 28.9% |
| Norwegians | 0.1 /100 | #323 | Tragic 29.0% |
| Croatians | 0.0 /100 | #324 | Tragic 29.0% |
Demographics Similar to Greeks by Wage/Income Gap
In terms of wage/income gap, the demographic groups most similar to Greeks are Immigrants from Israel (28.2%, a difference of 0.020%), Immigrants from Australia (28.2%, a difference of 0.13%), Slovene (28.3%, a difference of 0.13%), Northern European (28.3%, a difference of 0.13%), and Czechoslovakian (28.2%, a difference of 0.19%).
| Demographics | Rating | Rank | Wage/Income Gap |
| Okinawans | 0.4 /100 | #287 | Tragic 28.1% |
| Choctaw | 0.4 /100 | #288 | Tragic 28.1% |
| Canadians | 0.3 /100 | #289 | Tragic 28.1% |
| Australians | 0.3 /100 | #290 | Tragic 28.2% |
| Czechoslovakians | 0.3 /100 | #291 | Tragic 28.2% |
| Immigrants | Australia | 0.3 /100 | #292 | Tragic 28.2% |
| Immigrants | Israel | 0.3 /100 | #293 | Tragic 28.2% |
| Greeks | 0.3 /100 | #294 | Tragic 28.2% |
| Slovenes | 0.3 /100 | #295 | Tragic 28.3% |
| Northern Europeans | 0.3 /100 | #296 | Tragic 28.3% |
| Immigrants | North America | 0.2 /100 | #297 | Tragic 28.4% |
| Austrians | 0.2 /100 | #298 | Tragic 28.4% |
| Immigrants | North Macedonia | 0.2 /100 | #299 | Tragic 28.4% |
| Immigrants | Northern Europe | 0.2 /100 | #300 | Tragic 28.5% |
| Immigrants | Canada | 0.2 /100 | #301 | Tragic 28.5% |