South American vs Greek Currently Married
COMPARE
South American
Greek
Currently Married
Currently Married Comparison
South Americans
Greeks
46.1%
CURRENTLY MARRIED
23.8/ 100
METRIC RATING
194th/ 347
METRIC RANK
48.8%
CURRENTLY MARRIED
99.3/ 100
METRIC RATING
41st/ 347
METRIC RANK
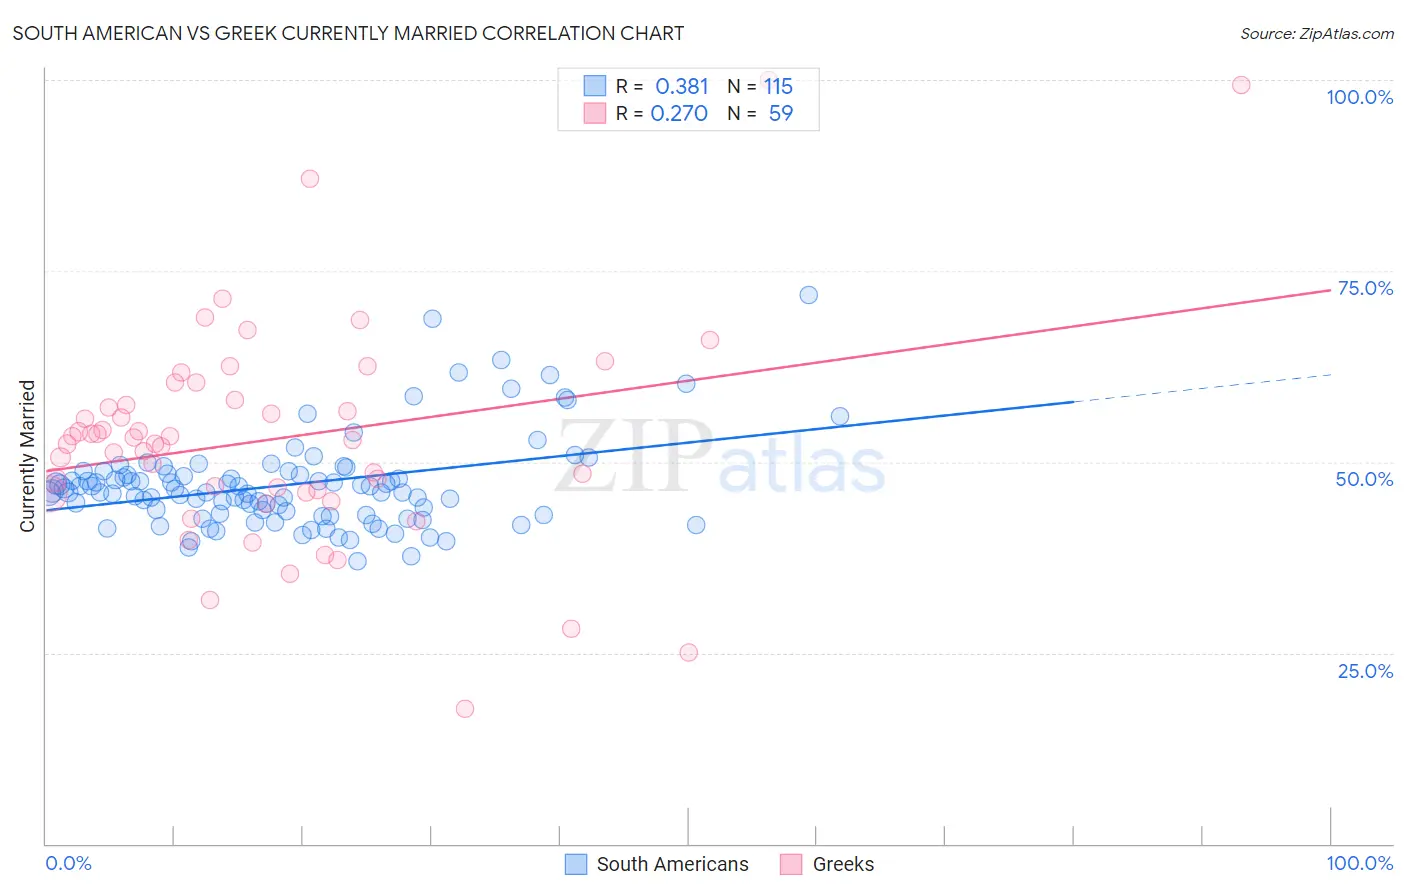
South American vs Greek Currently Married Correlation Chart
The statistical analysis conducted on geographies consisting of 494,081,354 people shows a mild positive correlation between the proportion of South Americans and percentage of population currently married in the United States with a correlation coefficient (R) of 0.381 and weighted average of 46.1%. Similarly, the statistical analysis conducted on geographies consisting of 482,696,171 people shows a weak positive correlation between the proportion of Greeks and percentage of population currently married in the United States with a correlation coefficient (R) of 0.270 and weighted average of 48.8%, a difference of 5.7%.
Currently Married Correlation Summary
| Measurement | South American | Greek |
| Minimum | 37.0% | 17.7% |
| Maximum | 71.9% | 100.0% |
| Range | 34.9% | 82.3% |
| Mean | 47.0% | 53.0% |
| Median | 46.1% | 52.8% |
| Interquartile 25% (IQ1) | 43.1% | 46.0% |
| Interquartile 75% (IQ3) | 48.4% | 58.1% |
| Interquartile Range (IQR) | 5.3% | 12.1% |
| Standard Deviation (Sample) | 6.0% | 14.5% |
| Standard Deviation (Population) | 6.0% | 14.4% |
Similar Demographics by Currently Married
Demographics Similar to South Americans by Currently Married
In terms of currently married, the demographic groups most similar to South Americans are Immigrants from Nepal (46.1%, a difference of 0.010%), Immigrants from Fiji (46.2%, a difference of 0.060%), Immigrants from Bosnia and Herzegovina (46.1%, a difference of 0.080%), Soviet Union (46.2%, a difference of 0.10%), and Immigrants from Kuwait (46.1%, a difference of 0.11%).
| Demographics | Rating | Rank | Currently Married |
| Immigrants | Peru | 35.3 /100 | #187 | Fair 46.4% |
| Colombians | 31.8 /100 | #188 | Fair 46.3% |
| Fijians | 30.3 /100 | #189 | Fair 46.3% |
| Choctaw | 29.1 /100 | #190 | Fair 46.3% |
| Immigrants | France | 27.7 /100 | #191 | Fair 46.2% |
| Soviet Union | 25.7 /100 | #192 | Fair 46.2% |
| Immigrants | Fiji | 25.0 /100 | #193 | Fair 46.2% |
| South Americans | 23.8 /100 | #194 | Fair 46.1% |
| Immigrants | Nepal | 23.7 /100 | #195 | Fair 46.1% |
| Immigrants | Bosnia and Herzegovina | 22.2 /100 | #196 | Fair 46.1% |
| Immigrants | Kuwait | 21.7 /100 | #197 | Fair 46.1% |
| Immigrants | Colombia | 21.0 /100 | #198 | Fair 46.1% |
| Immigrants | Costa Rica | 19.6 /100 | #199 | Poor 46.0% |
| Creek | 17.2 /100 | #200 | Poor 46.0% |
| Malaysians | 15.3 /100 | #201 | Poor 45.9% |
Demographics Similar to Greeks by Currently Married
In terms of currently married, the demographic groups most similar to Greeks are Immigrants from Canada (48.8%, a difference of 0.020%), British (48.8%, a difference of 0.040%), Finnish (48.8%, a difference of 0.050%), Scotch-Irish (48.7%, a difference of 0.050%), and Czechoslovakian (48.8%, a difference of 0.070%).
| Demographics | Rating | Rank | Currently Married |
| Immigrants | Lithuania | 99.4 /100 | #34 | Exceptional 48.8% |
| Immigrants | Northern Europe | 99.4 /100 | #35 | Exceptional 48.8% |
| Italians | 99.4 /100 | #36 | Exceptional 48.8% |
| Hungarians | 99.4 /100 | #37 | Exceptional 48.8% |
| Czechoslovakians | 99.4 /100 | #38 | Exceptional 48.8% |
| British | 99.4 /100 | #39 | Exceptional 48.8% |
| Immigrants | Canada | 99.4 /100 | #40 | Exceptional 48.8% |
| Greeks | 99.3 /100 | #41 | Exceptional 48.8% |
| Finns | 99.3 /100 | #42 | Exceptional 48.8% |
| Scotch-Irish | 99.3 /100 | #43 | Exceptional 48.7% |
| Immigrants | North America | 99.3 /100 | #44 | Exceptional 48.7% |
| Belgians | 99.3 /100 | #45 | Exceptional 48.7% |
| Immigrants | Iran | 99.2 /100 | #46 | Exceptional 48.7% |
| Northern Europeans | 99.2 /100 | #47 | Exceptional 48.7% |
| Austrians | 99.2 /100 | #48 | Exceptional 48.7% |