Haitian vs Peruvian Wage/Income Gap
COMPARE
Haitian
Peruvian
Wage/Income Gap
Wage/Income Gap Comparison
Haitians
Peruvians
19.7%
WAGE/INCOME GAP
100.0/ 100
METRIC RATING
17th/ 347
METRIC RANK
25.6%
WAGE/INCOME GAP
60.1/ 100
METRIC RATING
169th/ 347
METRIC RANK
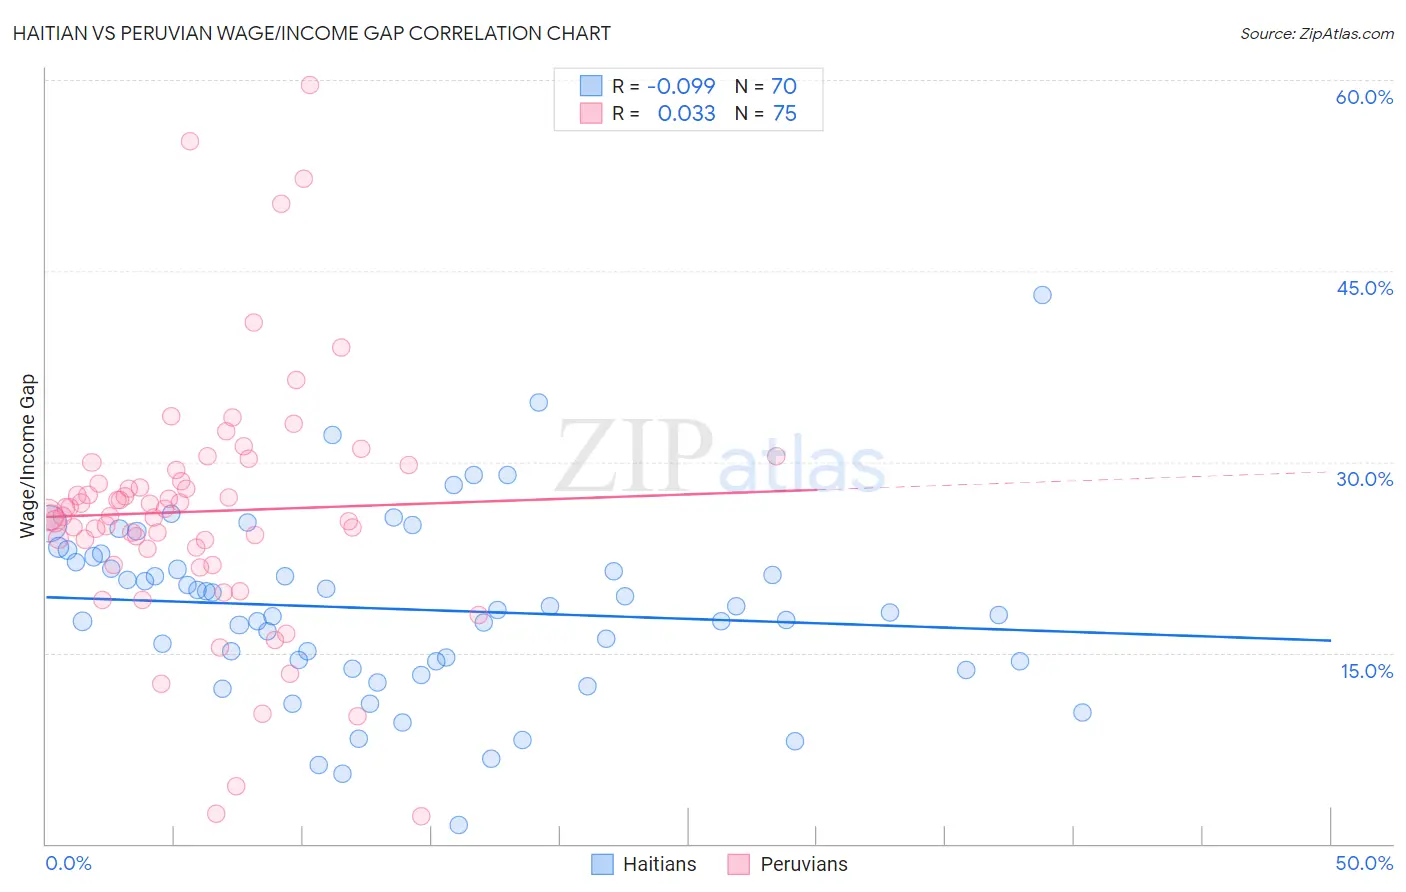
Haitian vs Peruvian Wage/Income Gap Correlation Chart
The statistical analysis conducted on geographies consisting of 287,832,408 people shows a slight negative correlation between the proportion of Haitians and wage/income gap percentage in the United States with a correlation coefficient (R) of -0.099 and weighted average of 19.7%. Similarly, the statistical analysis conducted on geographies consisting of 363,114,915 people shows no correlation between the proportion of Peruvians and wage/income gap percentage in the United States with a correlation coefficient (R) of 0.033 and weighted average of 25.6%, a difference of 29.7%.
Wage/Income Gap Correlation Summary
| Measurement | Haitian | Peruvian |
| Minimum | 1.5% | 2.2% |
| Maximum | 43.2% | 59.6% |
| Range | 41.7% | 57.4% |
| Mean | 18.4% | 26.1% |
| Median | 18.3% | 25.9% |
| Interquartile 25% (IQ1) | 14.4% | 23.1% |
| Interquartile 75% (IQ3) | 22.1% | 29.3% |
| Interquartile Range (IQR) | 7.7% | 6.2% |
| Standard Deviation (Sample) | 7.1% | 9.9% |
| Standard Deviation (Population) | 7.0% | 9.8% |
Similar Demographics by Wage/Income Gap
Demographics Similar to Haitians by Wage/Income Gap
In terms of wage/income gap, the demographic groups most similar to Haitians are Jamaican (19.6%, a difference of 0.78%), West Indian (19.6%, a difference of 0.91%), Hopi (20.0%, a difference of 1.4%), Immigrants from Dominica (20.0%, a difference of 1.4%), and Immigrants from Trinidad and Tobago (19.3%, a difference of 2.1%).
| Demographics | Rating | Rank | Wage/Income Gap |
| Crow | 100.0 /100 | #10 | Exceptional 19.1% |
| Immigrants | Haiti | 100.0 /100 | #11 | Exceptional 19.2% |
| Immigrants | West Indies | 100.0 /100 | #12 | Exceptional 19.2% |
| Trinidadians and Tobagonians | 100.0 /100 | #13 | Exceptional 19.3% |
| Immigrants | Trinidad and Tobago | 100.0 /100 | #14 | Exceptional 19.3% |
| West Indians | 100.0 /100 | #15 | Exceptional 19.6% |
| Jamaicans | 100.0 /100 | #16 | Exceptional 19.6% |
| Haitians | 100.0 /100 | #17 | Exceptional 19.7% |
| Hopi | 100.0 /100 | #18 | Exceptional 20.0% |
| Immigrants | Dominica | 100.0 /100 | #19 | Exceptional 20.0% |
| Bahamians | 100.0 /100 | #20 | Exceptional 20.2% |
| Immigrants | Caribbean | 100.0 /100 | #21 | Exceptional 20.4% |
| Immigrants | Liberia | 100.0 /100 | #22 | Exceptional 20.6% |
| Immigrants | Dominican Republic | 100.0 /100 | #23 | Exceptional 20.6% |
| Dominicans | 100.0 /100 | #24 | Exceptional 20.6% |
Demographics Similar to Peruvians by Wage/Income Gap
In terms of wage/income gap, the demographic groups most similar to Peruvians are Immigrants from Oceania (25.6%, a difference of 0.17%), Seminole (25.6%, a difference of 0.18%), Paiute (25.5%, a difference of 0.20%), Immigrants from Greece (25.7%, a difference of 0.23%), and Immigrants from Ukraine (25.5%, a difference of 0.26%).
| Demographics | Rating | Rank | Wage/Income Gap |
| Shoshone | 69.0 /100 | #162 | Good 25.4% |
| Native Hawaiians | 69.0 /100 | #163 | Good 25.4% |
| Koreans | 68.6 /100 | #164 | Good 25.4% |
| Immigrants | Hong Kong | 64.0 /100 | #165 | Good 25.5% |
| Immigrants | Ukraine | 63.8 /100 | #166 | Good 25.5% |
| Paiute | 62.9 /100 | #167 | Good 25.5% |
| Seminole | 62.6 /100 | #168 | Good 25.6% |
| Peruvians | 60.1 /100 | #169 | Good 25.6% |
| Immigrants | Oceania | 57.5 /100 | #170 | Average 25.6% |
| Immigrants | Greece | 56.6 /100 | #171 | Average 25.7% |
| Immigrants | Chile | 53.2 /100 | #172 | Average 25.7% |
| Immigrants | Belarus | 52.9 /100 | #173 | Average 25.7% |
| Alaskan Athabascans | 50.0 /100 | #174 | Average 25.8% |
| Sri Lankans | 47.0 /100 | #175 | Average 25.8% |
| Paraguayans | 46.7 /100 | #176 | Average 25.8% |