Vietnamese vs Immigrants from Brazil Median Female Earnings

COMPARE

Vietnamese
Race
Ancestry
AfghanAfricanAlaska NativeAlaskan AthabascanAlbanianAleutAlsatianAmericanApacheArabArapahoArgentineanArmenianAssyrian/Chaldean/SyriacAustralianAustrianBahamianBangladeshiBarbadianBasqueBelgianBelizeanBermudanBhutaneseBlackfeetBolivianBrazilianBritishBritish West IndianBulgarianBurmeseCajunCambodianCanadianCape VerdeanCarpatho RusynCelticCentral AmericanCentral American IndianCherokeeCheyenneChickasawChileanChineseChippewaChoctawColombianColvilleComancheCosta RicanCreeCreekCroatianCrowCubanCypriotCzechCzechoslovakianDanishDelawareDominicanDutchDutch West IndianEastern EuropeanEcuadorianEgyptianEnglishEstonianEthiopianEuropeanFijianFilipinoFinnishFrenchFrench American IndianFrench CanadianGermanGerman RussianGhanaianGreekGuamanian/ChamorroGuatemalanGuyaneseHaitianHmongHonduranHopiHoumaHungarianIcelanderIndian (Asian)IndonesianInupiatIranianIraqiIrishIroquoisIsraeliItalianJamaicanJapaneseJordanianKenyanKiowaKoreanLaotianLatvianLebaneseLiberianLithuanianLumbeeLuxembourgerMacedonianMalaysianMalteseMarshalleseMenomineeMexicanMexican American IndianMongolianMoroccanNative HawaiianNavajoNepaleseNew ZealanderNicaraguanNigerianNorthern EuropeanNorwegianOkinawanOsageOttawaPaiutePakistaniPalestinianPanamanianParaguayanPennsylvania GermanPeruvianPimaPolishPortuguesePotawatomiPuebloPuerto RicanPuget Sound SalishRomanianRussianSalvadoranSamoanScandinavianScotch-IrishScottishSeminoleSenegaleseSerbianShoshoneSierra LeoneanSiouxSlavicSlovakSloveneSomaliSouth AfricanSouth AmericanSouth American IndianSoviet UnionSpaniardSpanishSpanish AmericanSpanish American IndianSri LankanSubsaharan AfricanSudaneseSwedishSwissSyrianTaiwaneseThaiTlingit-HaidaTohono O'OdhamTonganTrinidadian and TobagonianTsimshianTurkishU.S. Virgin IslanderUgandanUkrainianUruguayanUteVenezuelanVietnameseWelshWest IndianYakamaYaquiYugoslavianYumanYup'ikZimbabwean
Immigration
NonimmigrantsImmigrantsAfghanistanAfricaAlbaniaArgentinaArmeniaAsiaAustraliaAustriaBahamasBangladeshBarbadosBelarusBelgiumBelizeBoliviaBosnia and HerzegovinaBulgariaBurma/MyanmarCabo VerdeCambodiaCameroonCanadaCaribbeanCentral AmericaChileChinaColombiaCongoCosta RicaCroatiaCubaCzechoslovakiaDenmarkDominicaDominican RepublicEastern AfricaEastern AsiaEastern EuropeEcuadorEgyptEl SalvadorEnglandEritreaEthiopiaEuropeFijiFranceGermanyGhanaGreeceGrenadaGuatemalaGuyanaHaitiHondurasHong KongHungaryIndiaIndonesiaIranIraqIrelandIsraelItalyJamaicaJapanJordanKazakhstanKenyaKoreaKuwaitLaosLatin AmericaLatviaLebanonLiberiaLithuaniaMalaysiaMexicoMicronesiaMiddle AfricaMoldovaMoroccoNepalNetherlandsNicaraguaNigeriaNorth AmericaNorth MacedoniaNorthern AfricaNorthern EuropeNorwayOceaniaPakistanPanamaPeruPhilippinesPolandPortugalRomaniaRussiaSaudi ArabiaScotlandSenegalSerbiaSierra LeoneSingaporeSomaliaSouth AfricaSouth AmericaSouth Central AsiaSouth Eastern AsiaSouthern EuropeSpainSri LankaSt. Vincent and the GrenadinesSudanSwedenSwitzerlandSyriaTaiwanThailandTrinidad and TobagoTurkeyUgandaUkraineUruguayUzbekistanVenezuelaVietnamWest IndiesWestern AfricaWestern AsiaWestern EuropeYemenZaireZimbabweAzores
Immigrants from Brazil
Race
Ancestry
AfghanAfricanAlaska NativeAlaskan AthabascanAlbanianAleutAlsatianAmericanApacheArabArapahoArgentineanArmenianAssyrian/Chaldean/SyriacAustralianAustrianBahamianBangladeshiBarbadianBasqueBelgianBelizeanBermudanBhutaneseBlackfeetBolivianBrazilianBritishBritish West IndianBulgarianBurmeseCajunCambodianCanadianCape VerdeanCarpatho RusynCelticCentral AmericanCentral American IndianCherokeeCheyenneChickasawChileanChineseChippewaChoctawColombianColvilleComancheCosta RicanCreeCreekCroatianCrowCubanCypriotCzechCzechoslovakianDanishDelawareDominicanDutchDutch West IndianEastern EuropeanEcuadorianEgyptianEnglishEstonianEthiopianEuropeanFijianFilipinoFinnishFrenchFrench American IndianFrench CanadianGermanGerman RussianGhanaianGreekGuamanian/ChamorroGuatemalanGuyaneseHaitianHmongHonduranHopiHoumaHungarianIcelanderIndian (Asian)IndonesianInupiatIranianIraqiIrishIroquoisIsraeliItalianJamaicanJapaneseJordanianKenyanKiowaKoreanLaotianLatvianLebaneseLiberianLithuanianLumbeeLuxembourgerMacedonianMalaysianMalteseMarshalleseMenomineeMexicanMexican American IndianMongolianMoroccanNative HawaiianNavajoNepaleseNew ZealanderNicaraguanNigerianNorthern EuropeanNorwegianOkinawanOsageOttawaPaiutePakistaniPalestinianPanamanianParaguayanPennsylvania GermanPeruvianPimaPolishPortuguesePotawatomiPuebloPuerto RicanPuget Sound SalishRomanianRussianSalvadoranSamoanScandinavianScotch-IrishScottishSeminoleSenegaleseSerbianShoshoneSierra LeoneanSiouxSlavicSlovakSloveneSomaliSouth AfricanSouth AmericanSouth American IndianSoviet UnionSpaniardSpanishSpanish AmericanSpanish American IndianSri LankanSubsaharan AfricanSudaneseSwedishSwissSyrianTaiwaneseThaiTlingit-HaidaTohono O'OdhamTonganTrinidadian and TobagonianTsimshianTurkishU.S. Virgin IslanderUgandanUkrainianUruguayanUteVenezuelanWelshWest IndianYakamaYaquiYugoslavianYumanYup'ikZimbabwean
Immigration
NonimmigrantsImmigrantsAfghanistanAfricaAlbaniaArgentinaArmeniaAsiaAustraliaAustriaBahamasBangladeshBarbadosBelarusBelgiumBelizeBoliviaBosnia and HerzegovinaBrazilBulgariaBurma/MyanmarCabo VerdeCambodiaCameroonCanadaCaribbeanCentral AmericaChileChinaColombiaCongoCosta RicaCroatiaCubaCzechoslovakiaDenmarkDominicaDominican RepublicEastern AfricaEastern AsiaEastern EuropeEcuadorEgyptEl SalvadorEnglandEritreaEthiopiaEuropeFijiFranceGermanyGhanaGreeceGrenadaGuatemalaGuyanaHaitiHondurasHong KongHungaryIndiaIndonesiaIranIraqIrelandIsraelItalyJamaicaJapanJordanKazakhstanKenyaKoreaKuwaitLaosLatin AmericaLatviaLebanonLiberiaLithuaniaMalaysiaMexicoMicronesiaMiddle AfricaMoldovaMoroccoNepalNetherlandsNicaraguaNigeriaNorth AmericaNorth MacedoniaNorthern AfricaNorthern EuropeNorwayOceaniaPakistanPanamaPeruPhilippinesPolandPortugalRomaniaRussiaSaudi ArabiaScotlandSenegalSerbiaSierra LeoneSingaporeSomaliaSouth AfricaSouth AmericaSouth Central AsiaSouth Eastern AsiaSouthern EuropeSpainSri LankaSt. Vincent and the GrenadinesSudanSwedenSwitzerlandSyriaTaiwanThailandTrinidad and TobagoTurkeyUgandaUkraineUruguayUzbekistanVenezuelaVietnamWest IndiesWestern AfricaWestern AsiaWestern EuropeYemenZaireZimbabweAzores
Median Female Earnings
Income
Poverty
Unemployment
Labor Participation
Family Structure
Vehicle Availability
Education Level
Disability

Median Female Earnings Comparison

Vietnamese

Immigrants from Brazil

Excellent
Exceptional
$40,377
MEDIAN FEMALE EARNINGS
80.4/ 100
METRIC RATING
147th/ 347
METRIC RANK
$41,273
MEDIAN FEMALE EARNINGS
96.4/ 100
METRIC RATING
116th/ 347
METRIC RANK

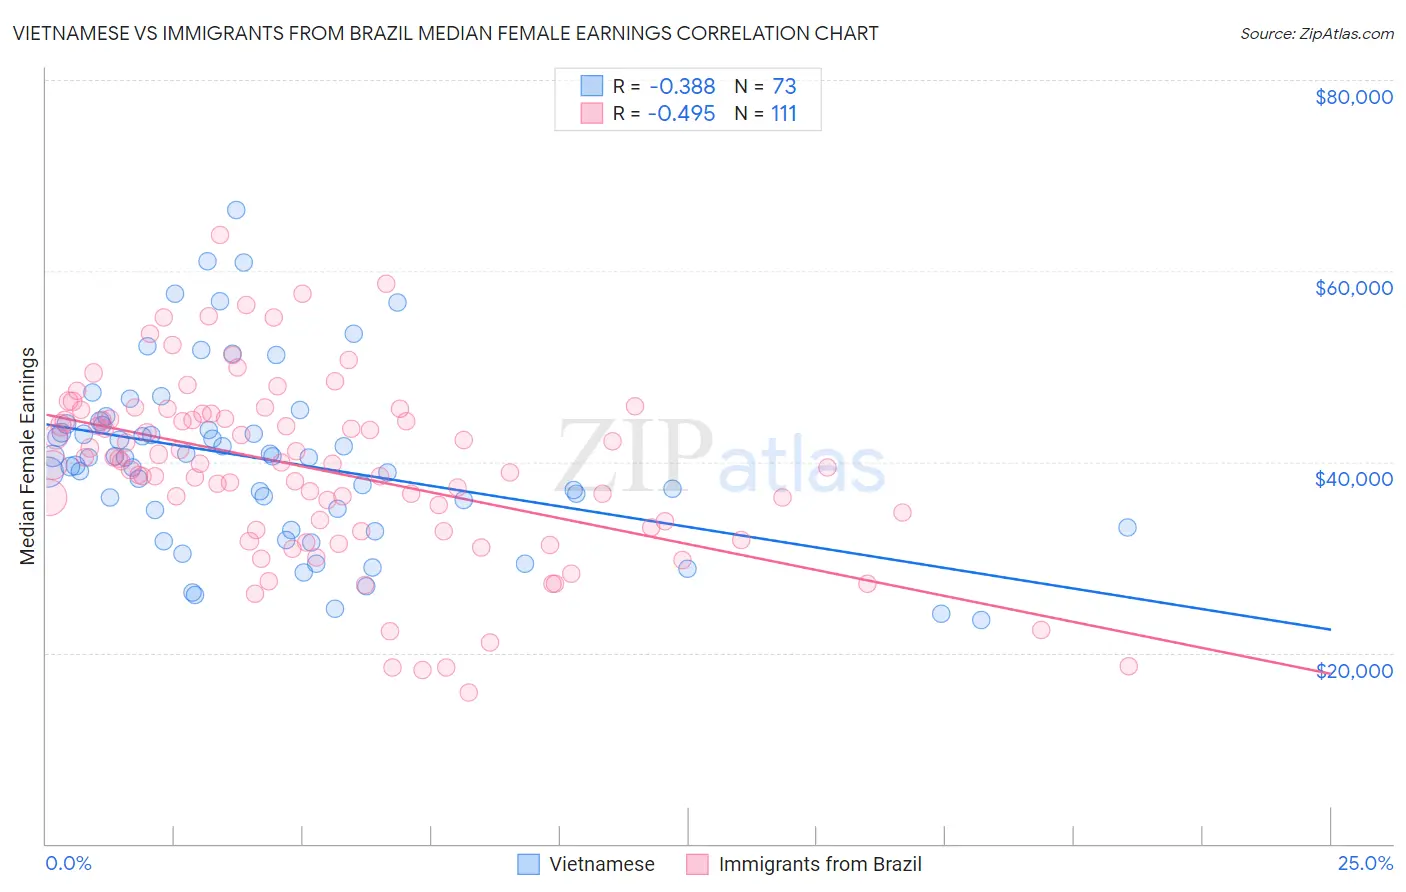
Vietnamese vs Immigrants from Brazil Median Female Earnings Correlation Chart

The statistical analysis conducted on geographies consisting of 170,738,706 people shows a mild negative correlation between the proportion of Vietnamese and median female earnings in the United States with a correlation coefficient (R) of -0.388 and weighted average of $40,377. Similarly, the statistical analysis conducted on geographies consisting of 342,933,963 people shows a moderate negative correlation between the proportion of Immigrants from Brazil and median female earnings in the United States with a correlation coefficient (R) of -0.495 and weighted average of $41,273, a difference of 2.2%.
Vietnamese vs Immigrants from Brazil Median Female Earnings

Median Female Earnings Correlation Summary

MeasurementVietnameseImmigrants from Brazil
Minimum$23,385$15,833
Maximum$66,442$63,747
Range$43,057$47,914
Mean$40,184$39,161
Median$40,448$39,865
Interquartile 25% (IQ1)$34,018$32,810
Interquartile 75% (IQ3)$43,912$44,568
Interquartile Range (IQR)$9,894$11,758
Standard Deviation (Sample)$9,135$9,325
Standard Deviation (Population)$9,072$9,283

Similar Demographics by Median Female Earnings

Demographics Similar to Vietnamese by Median Female Earnings

In terms of median female earnings, the demographic groups most similar to Vietnamese are Polish ($40,371, a difference of 0.020%), Immigrants from Cameroon ($40,354, a difference of 0.060%), Immigrants from Chile ($40,353, a difference of 0.060%), Immigrants from Armenia ($40,340, a difference of 0.090%), and Ghanaian ($40,429, a difference of 0.13%).
DemographicsRating | RankMedian Female Earnings
Serbians
85.2
/100
|
#140
Excellent
$40,539
Immigrants | Syria
84.1
/100
|
#141
Excellent
$40,499
Sri Lankans
84.0
/100
|
#142
Excellent
$40,496
Northern Europeans
83.9
/100
|
#143
Excellent
$40,491
Immigrants | North Macedonia
83.8
/100
|
#144
Excellent
$40,488
Brazilians
83.6
/100
|
#145
Excellent
$40,483
Ghanaians
82.1
/100
|
#146
Excellent
$40,429
Vietnamese
80.4
/100
|
#147
Excellent
$40,377
Poles
80.2
/100
|
#148
Excellent
$40,371
Immigrants | Cameroon
79.7
/100
|
#149
Good
$40,354
Immigrants | Chile
79.6
/100
|
#150
Good
$40,353
Immigrants | Armenia
79.2
/100
|
#151
Good
$40,340
West Indians
78.4
/100
|
#152
Good
$40,317
British West Indians
77.7
/100
|
#153
Good
$40,299
Immigrants | Oceania
77.6
/100
|
#154
Good
$40,297

Demographics Similar to Immigrants from Brazil by Median Female Earnings

In terms of median female earnings, the demographic groups most similar to Immigrants from Brazil are Immigrants from England ($41,277, a difference of 0.010%), Korean ($41,276, a difference of 0.010%), Macedonian ($41,286, a difference of 0.030%), Barbadian ($41,261, a difference of 0.030%), and Immigrants from North America ($41,319, a difference of 0.11%).
DemographicsRating | RankMedian Female Earnings
Chinese
97.5
/100
|
#109
Exceptional
$41,461
Immigrants | Western Asia
97.0
/100
|
#110
Exceptional
$41,375
Immigrants | Canada
97.0
/100
|
#111
Exceptional
$41,373
Immigrants | North America
96.7
/100
|
#112
Exceptional
$41,319
Macedonians
96.4
/100
|
#113
Exceptional
$41,286
Immigrants | England
96.4
/100
|
#114
Exceptional
$41,277
Koreans
96.4
/100
|
#115
Exceptional
$41,276
Immigrants | Brazil
96.4
/100
|
#116
Exceptional
$41,273
Barbadians
96.3
/100
|
#117
Exceptional
$41,261
Immigrants | Lebanon
95.6
/100
|
#118
Exceptional
$41,183
Immigrants | Philippines
95.0
/100
|
#119
Exceptional
$41,114
Immigrants | Kuwait
94.4
/100
|
#120
Exceptional
$41,055
Croatians
93.7
/100
|
#121
Exceptional
$40,993
Immigrants | Jordan
93.5
/100
|
#122
Exceptional
$40,977
Guyanese
93.4
/100
|
#123
Exceptional
$40,973