Slavic vs Immigrants from Brazil Median Earnings
COMPARE
Slavic
Immigrants from Brazil
Median Earnings
Median Earnings Comparison
Slavs
Immigrants from Brazil
$47,470
MEDIAN EARNINGS
81.1/ 100
METRIC RATING
153rd/ 347
METRIC RANK
$49,463
MEDIAN EARNINGS
98.6/ 100
METRIC RATING
104th/ 347
METRIC RANK
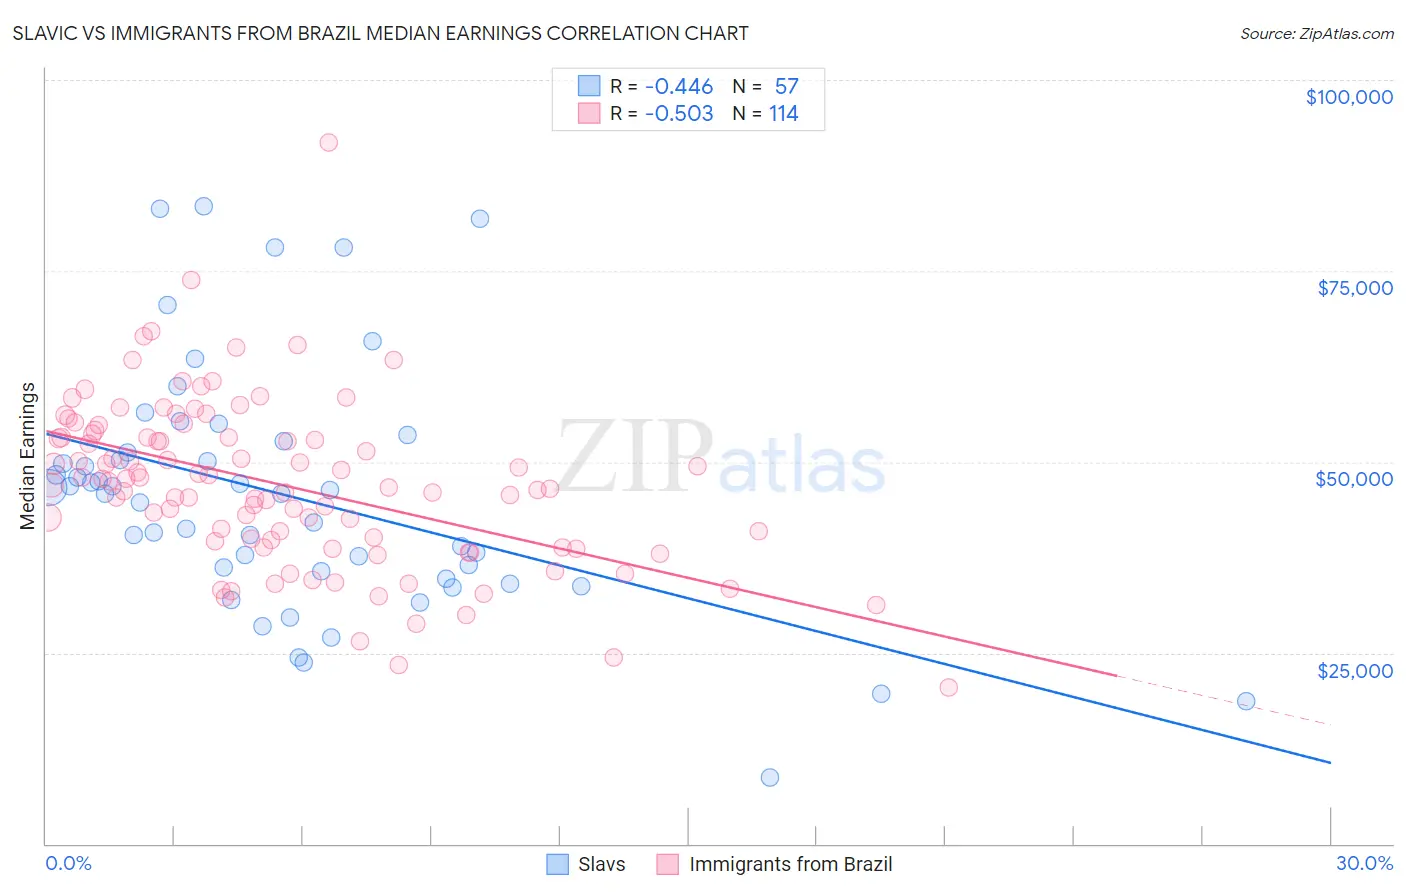
Slavic vs Immigrants from Brazil Median Earnings Correlation Chart
The statistical analysis conducted on geographies consisting of 270,868,378 people shows a moderate negative correlation between the proportion of Slavs and median earnings in the United States with a correlation coefficient (R) of -0.446 and weighted average of $47,470. Similarly, the statistical analysis conducted on geographies consisting of 343,004,043 people shows a substantial negative correlation between the proportion of Immigrants from Brazil and median earnings in the United States with a correlation coefficient (R) of -0.503 and weighted average of $49,463, a difference of 4.2%.
Median Earnings Correlation Summary
| Measurement | Slavic | Immigrants from Brazil |
| Minimum | $8,672 | $20,417 |
| Maximum | $83,496 | $91,768 |
| Range | $74,824 | $71,351 |
| Mean | $45,520 | $47,008 |
| Median | $45,848 | $47,178 |
| Interquartile 25% (IQ1) | $35,213 | $39,617 |
| Interquartile 75% (IQ3) | $51,961 | $53,219 |
| Interquartile Range (IQR) | $16,749 | $13,601 |
| Standard Deviation (Sample) | $16,076 | $10,976 |
| Standard Deviation (Population) | $15,935 | $10,928 |
Similar Demographics by Median Earnings
Demographics Similar to Slavs by Median Earnings
In terms of median earnings, the demographic groups most similar to Slavs are Immigrants from Germany ($47,566, a difference of 0.20%), Immigrants from Oceania ($47,617, a difference of 0.31%), Peruvian ($47,628, a difference of 0.33%), Immigrants from Portugal ($47,304, a difference of 0.35%), and Luxembourger ($47,640, a difference of 0.36%).
| Demographics | Rating | Rank | Median Earnings |
| Immigrants | Chile | 85.5 /100 | #146 | Excellent $47,697 |
| Immigrants | South Eastern Asia | 85.0 /100 | #147 | Excellent $47,671 |
| Immigrants | Eritrea | 84.8 /100 | #148 | Excellent $47,657 |
| Luxembourgers | 84.5 /100 | #149 | Excellent $47,640 |
| Peruvians | 84.2 /100 | #150 | Excellent $47,628 |
| Immigrants | Oceania | 84.1 /100 | #151 | Excellent $47,617 |
| Immigrants | Germany | 83.1 /100 | #152 | Excellent $47,566 |
| Slavs | 81.1 /100 | #153 | Excellent $47,470 |
| Immigrants | Portugal | 77.3 /100 | #154 | Good $47,304 |
| Immigrants | Vietnam | 76.7 /100 | #155 | Good $47,282 |
| Irish | 76.6 /100 | #156 | Good $47,276 |
| Czechs | 75.1 /100 | #157 | Good $47,221 |
| Slovaks | 71.7 /100 | #158 | Good $47,095 |
| Immigrants | Peru | 69.6 /100 | #159 | Good $47,025 |
| Alsatians | 69.6 /100 | #160 | Good $47,023 |
Demographics Similar to Immigrants from Brazil by Median Earnings
In terms of median earnings, the demographic groups most similar to Immigrants from Brazil are Austrian ($49,501, a difference of 0.080%), Immigrants from Western Asia ($49,389, a difference of 0.15%), Immigrants from Albania ($49,377, a difference of 0.17%), Immigrants from Morocco ($49,368, a difference of 0.19%), and Ethiopian ($49,572, a difference of 0.22%).
| Demographics | Rating | Rank | Median Earnings |
| Immigrants | North Macedonia | 98.9 /100 | #97 | Exceptional $49,658 |
| Immigrants | Northern Africa | 98.9 /100 | #98 | Exceptional $49,648 |
| Immigrants | Afghanistan | 98.9 /100 | #99 | Exceptional $49,645 |
| Immigrants | Poland | 98.9 /100 | #100 | Exceptional $49,633 |
| Jordanians | 98.9 /100 | #101 | Exceptional $49,632 |
| Ethiopians | 98.8 /100 | #102 | Exceptional $49,572 |
| Austrians | 98.7 /100 | #103 | Exceptional $49,501 |
| Immigrants | Brazil | 98.6 /100 | #104 | Exceptional $49,463 |
| Immigrants | Western Asia | 98.4 /100 | #105 | Exceptional $49,389 |
| Immigrants | Albania | 98.4 /100 | #106 | Exceptional $49,377 |
| Immigrants | Morocco | 98.4 /100 | #107 | Exceptional $49,368 |
| Palestinians | 98.0 /100 | #108 | Exceptional $49,209 |
| Syrians | 97.1 /100 | #109 | Exceptional $48,934 |
| Immigrants | Ethiopia | 97.1 /100 | #110 | Exceptional $48,924 |
| Immigrants | Zimbabwe | 97.0 /100 | #111 | Exceptional $48,913 |