Bermudan vs Immigrants from Brazil Median Female Earnings
COMPARE
Bermudan
Immigrants from Brazil
Median Female Earnings
Median Female Earnings Comparison
Bermudans
Immigrants from Brazil
$39,418
MEDIAN FEMALE EARNINGS
35.9/ 100
METRIC RATING
188th/ 347
METRIC RANK
$41,273
MEDIAN FEMALE EARNINGS
96.4/ 100
METRIC RATING
116th/ 347
METRIC RANK
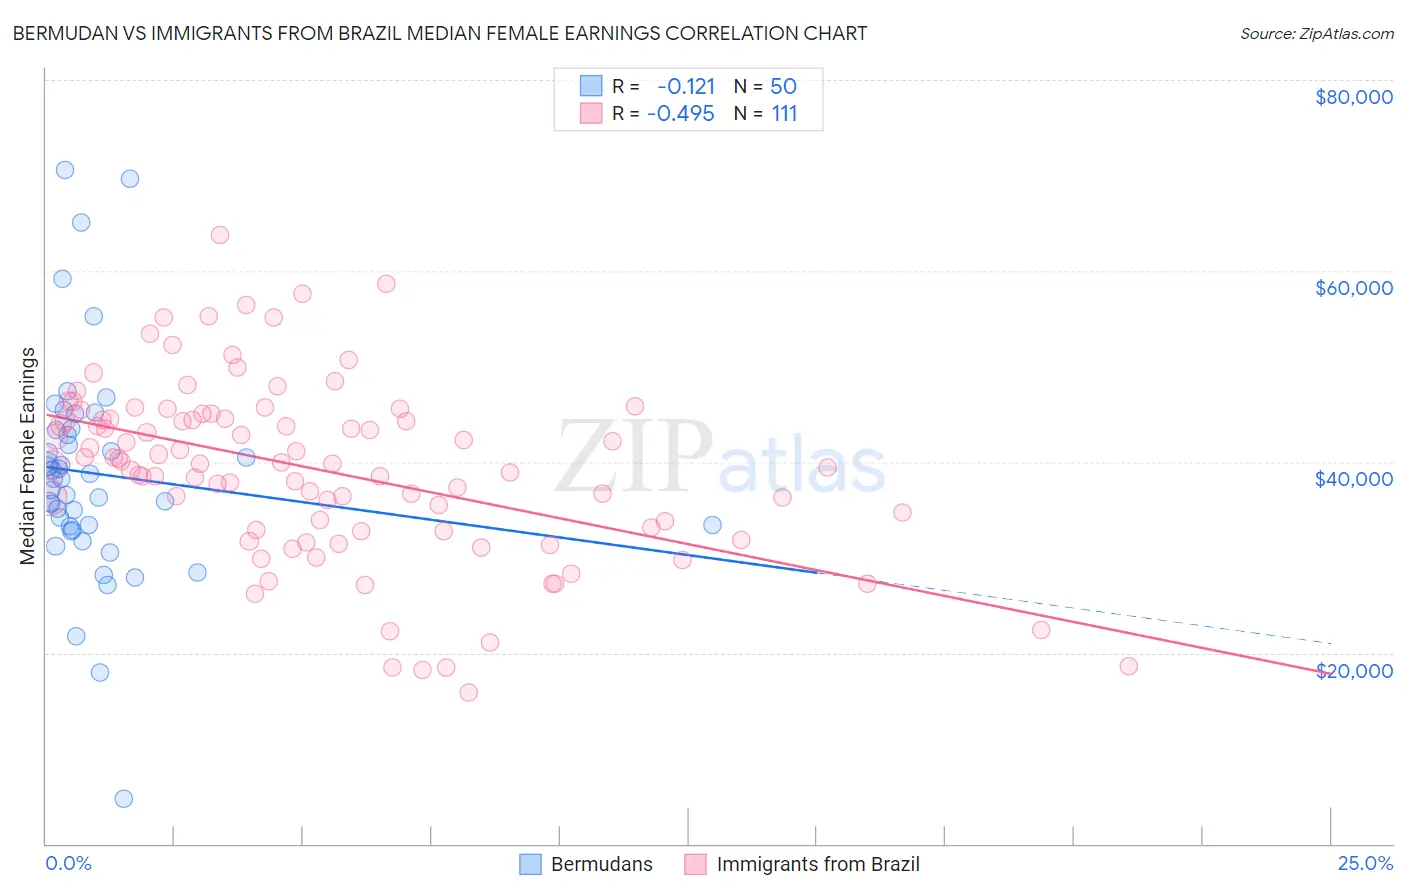
Bermudan vs Immigrants from Brazil Median Female Earnings Correlation Chart
The statistical analysis conducted on geographies consisting of 55,724,642 people shows a poor negative correlation between the proportion of Bermudans and median female earnings in the United States with a correlation coefficient (R) of -0.121 and weighted average of $39,418. Similarly, the statistical analysis conducted on geographies consisting of 342,933,963 people shows a moderate negative correlation between the proportion of Immigrants from Brazil and median female earnings in the United States with a correlation coefficient (R) of -0.495 and weighted average of $41,273, a difference of 4.7%.
Median Female Earnings Correlation Summary
| Measurement | Bermudan | Immigrants from Brazil |
| Minimum | $4,682 | $15,833 |
| Maximum | $70,590 | $63,747 |
| Range | $65,908 | $47,914 |
| Mean | $38,764 | $39,161 |
| Median | $38,256 | $39,865 |
| Interquartile 25% (IQ1) | $33,240 | $32,810 |
| Interquartile 75% (IQ3) | $43,282 | $44,568 |
| Interquartile Range (IQR) | $10,042 | $11,758 |
| Standard Deviation (Sample) | $11,556 | $9,325 |
| Standard Deviation (Population) | $11,440 | $9,283 |
Similar Demographics by Median Female Earnings
Demographics Similar to Bermudans by Median Female Earnings
In terms of median female earnings, the demographic groups most similar to Bermudans are Swedish ($39,421, a difference of 0.010%), Colombian ($39,439, a difference of 0.050%), Immigrants from West Indies ($39,441, a difference of 0.060%), Senegalese ($39,384, a difference of 0.090%), and European ($39,457, a difference of 0.10%).
| Demographics | Rating | Rank | Median Female Earnings |
| Tsimshian | 41.4 /100 | #181 | Average $39,530 |
| Tlingit-Haida | 40.5 /100 | #182 | Average $39,513 |
| Hungarians | 40.3 /100 | #183 | Average $39,510 |
| Europeans | 37.7 /100 | #184 | Fair $39,457 |
| Immigrants | West Indies | 36.9 /100 | #185 | Fair $39,441 |
| Colombians | 36.9 /100 | #186 | Fair $39,439 |
| Swedes | 36.0 /100 | #187 | Fair $39,421 |
| Bermudans | 35.9 /100 | #188 | Fair $39,418 |
| Senegalese | 34.2 /100 | #189 | Fair $39,384 |
| Puget Sound Salish | 33.9 /100 | #190 | Fair $39,376 |
| Immigrants | Western Africa | 32.7 /100 | #191 | Fair $39,351 |
| Immigrants | Immigrants | 31.7 /100 | #192 | Fair $39,328 |
| Immigrants | Nigeria | 30.2 /100 | #193 | Fair $39,294 |
| Irish | 30.0 /100 | #194 | Fair $39,291 |
| Uruguayans | 27.3 /100 | #195 | Fair $39,228 |
Demographics Similar to Immigrants from Brazil by Median Female Earnings
In terms of median female earnings, the demographic groups most similar to Immigrants from Brazil are Immigrants from England ($41,277, a difference of 0.010%), Korean ($41,276, a difference of 0.010%), Macedonian ($41,286, a difference of 0.030%), Barbadian ($41,261, a difference of 0.030%), and Immigrants from North America ($41,319, a difference of 0.11%).
| Demographics | Rating | Rank | Median Female Earnings |
| Chinese | 97.5 /100 | #109 | Exceptional $41,461 |
| Immigrants | Western Asia | 97.0 /100 | #110 | Exceptional $41,375 |
| Immigrants | Canada | 97.0 /100 | #111 | Exceptional $41,373 |
| Immigrants | North America | 96.7 /100 | #112 | Exceptional $41,319 |
| Macedonians | 96.4 /100 | #113 | Exceptional $41,286 |
| Immigrants | England | 96.4 /100 | #114 | Exceptional $41,277 |
| Koreans | 96.4 /100 | #115 | Exceptional $41,276 |
| Immigrants | Brazil | 96.4 /100 | #116 | Exceptional $41,273 |
| Barbadians | 96.3 /100 | #117 | Exceptional $41,261 |
| Immigrants | Lebanon | 95.6 /100 | #118 | Exceptional $41,183 |
| Immigrants | Philippines | 95.0 /100 | #119 | Exceptional $41,114 |
| Immigrants | Kuwait | 94.4 /100 | #120 | Exceptional $41,055 |
| Croatians | 93.7 /100 | #121 | Exceptional $40,993 |
| Immigrants | Jordan | 93.5 /100 | #122 | Exceptional $40,977 |
| Guyanese | 93.4 /100 | #123 | Exceptional $40,973 |