Cuban vs Immigrants from Brazil Median Female Earnings
COMPARE
Cuban
Immigrants from Brazil
Median Female Earnings
Median Female Earnings Comparison
Cubans
Immigrants from Brazil
$34,942
MEDIAN FEMALE EARNINGS
0.0/ 100
METRIC RATING
313th/ 347
METRIC RANK
$41,273
MEDIAN FEMALE EARNINGS
96.4/ 100
METRIC RATING
116th/ 347
METRIC RANK
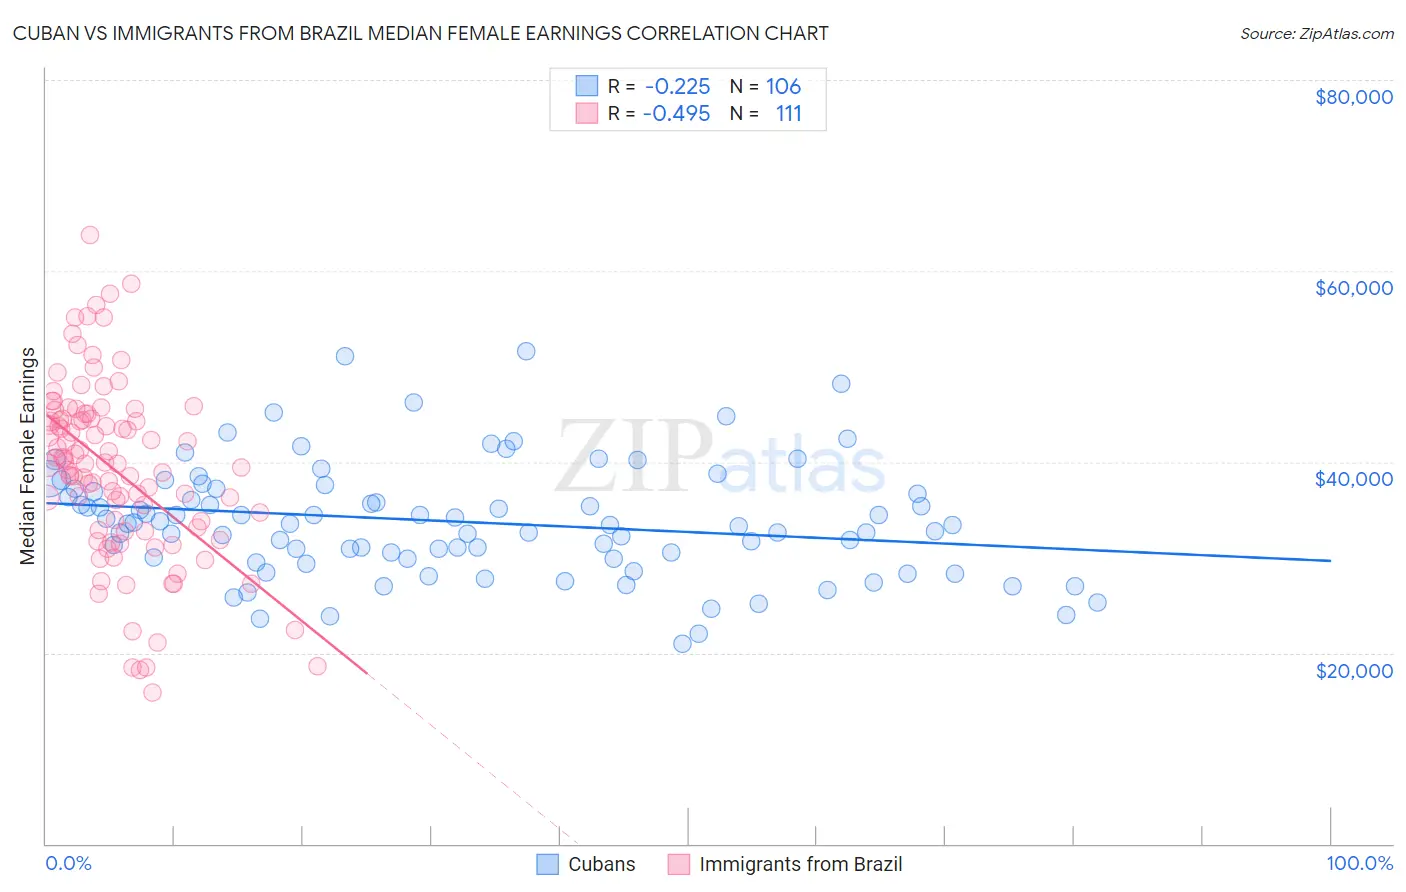
Cuban vs Immigrants from Brazil Median Female Earnings Correlation Chart
The statistical analysis conducted on geographies consisting of 449,056,362 people shows a weak negative correlation between the proportion of Cubans and median female earnings in the United States with a correlation coefficient (R) of -0.225 and weighted average of $34,942. Similarly, the statistical analysis conducted on geographies consisting of 342,933,963 people shows a moderate negative correlation between the proportion of Immigrants from Brazil and median female earnings in the United States with a correlation coefficient (R) of -0.495 and weighted average of $41,273, a difference of 18.1%.
Median Female Earnings Correlation Summary
| Measurement | Cuban | Immigrants from Brazil |
| Minimum | $20,938 | $15,833 |
| Maximum | $51,542 | $63,747 |
| Range | $30,604 | $47,914 |
| Mean | $33,741 | $39,161 |
| Median | $33,424 | $39,865 |
| Interquartile 25% (IQ1) | $29,890 | $32,810 |
| Interquartile 75% (IQ3) | $37,174 | $44,568 |
| Interquartile Range (IQR) | $7,284 | $11,758 |
| Standard Deviation (Sample) | $5,986 | $9,325 |
| Standard Deviation (Population) | $5,958 | $9,283 |
Similar Demographics by Median Female Earnings
Demographics Similar to Cubans by Median Female Earnings
In terms of median female earnings, the demographic groups most similar to Cubans are Yaqui ($34,943, a difference of 0.0%), Ute ($34,960, a difference of 0.050%), Apache ($34,895, a difference of 0.13%), Chippewa ($35,003, a difference of 0.17%), and Honduran ($35,013, a difference of 0.20%).
| Demographics | Rating | Rank | Median Female Earnings |
| Fijians | 0.0 /100 | #306 | Tragic $35,114 |
| Sioux | 0.0 /100 | #307 | Tragic $35,063 |
| Immigrants | Bahamas | 0.0 /100 | #308 | Tragic $35,027 |
| Hondurans | 0.0 /100 | #309 | Tragic $35,013 |
| Chippewa | 0.0 /100 | #310 | Tragic $35,003 |
| Ute | 0.0 /100 | #311 | Tragic $34,960 |
| Yaqui | 0.0 /100 | #312 | Tragic $34,943 |
| Cubans | 0.0 /100 | #313 | Tragic $34,942 |
| Apache | 0.0 /100 | #314 | Tragic $34,895 |
| Pennsylvania Germans | 0.0 /100 | #315 | Tragic $34,802 |
| Cherokee | 0.0 /100 | #316 | Tragic $34,742 |
| Potawatomi | 0.0 /100 | #317 | Tragic $34,739 |
| Immigrants | Yemen | 0.0 /100 | #318 | Tragic $34,693 |
| Shoshone | 0.0 /100 | #319 | Tragic $34,677 |
| Immigrants | Honduras | 0.0 /100 | #320 | Tragic $34,647 |
Demographics Similar to Immigrants from Brazil by Median Female Earnings
In terms of median female earnings, the demographic groups most similar to Immigrants from Brazil are Immigrants from England ($41,277, a difference of 0.010%), Korean ($41,276, a difference of 0.010%), Macedonian ($41,286, a difference of 0.030%), Barbadian ($41,261, a difference of 0.030%), and Immigrants from North America ($41,319, a difference of 0.11%).
| Demographics | Rating | Rank | Median Female Earnings |
| Chinese | 97.5 /100 | #109 | Exceptional $41,461 |
| Immigrants | Western Asia | 97.0 /100 | #110 | Exceptional $41,375 |
| Immigrants | Canada | 97.0 /100 | #111 | Exceptional $41,373 |
| Immigrants | North America | 96.7 /100 | #112 | Exceptional $41,319 |
| Macedonians | 96.4 /100 | #113 | Exceptional $41,286 |
| Immigrants | England | 96.4 /100 | #114 | Exceptional $41,277 |
| Koreans | 96.4 /100 | #115 | Exceptional $41,276 |
| Immigrants | Brazil | 96.4 /100 | #116 | Exceptional $41,273 |
| Barbadians | 96.3 /100 | #117 | Exceptional $41,261 |
| Immigrants | Lebanon | 95.6 /100 | #118 | Exceptional $41,183 |
| Immigrants | Philippines | 95.0 /100 | #119 | Exceptional $41,114 |
| Immigrants | Kuwait | 94.4 /100 | #120 | Exceptional $41,055 |
| Croatians | 93.7 /100 | #121 | Exceptional $40,993 |
| Immigrants | Jordan | 93.5 /100 | #122 | Exceptional $40,977 |
| Guyanese | 93.4 /100 | #123 | Exceptional $40,973 |