Scotch-Irish vs Okinawan Male Poverty
COMPARE
Scotch-Irish
Okinawan
Male Poverty
Male Poverty Comparison
Scotch-Irish
Okinawans
11.0%
MALE POVERTY
63.7/ 100
METRIC RATING
157th/ 347
METRIC RANK
10.7%
MALE POVERTY
87.6/ 100
METRIC RATING
118th/ 347
METRIC RANK
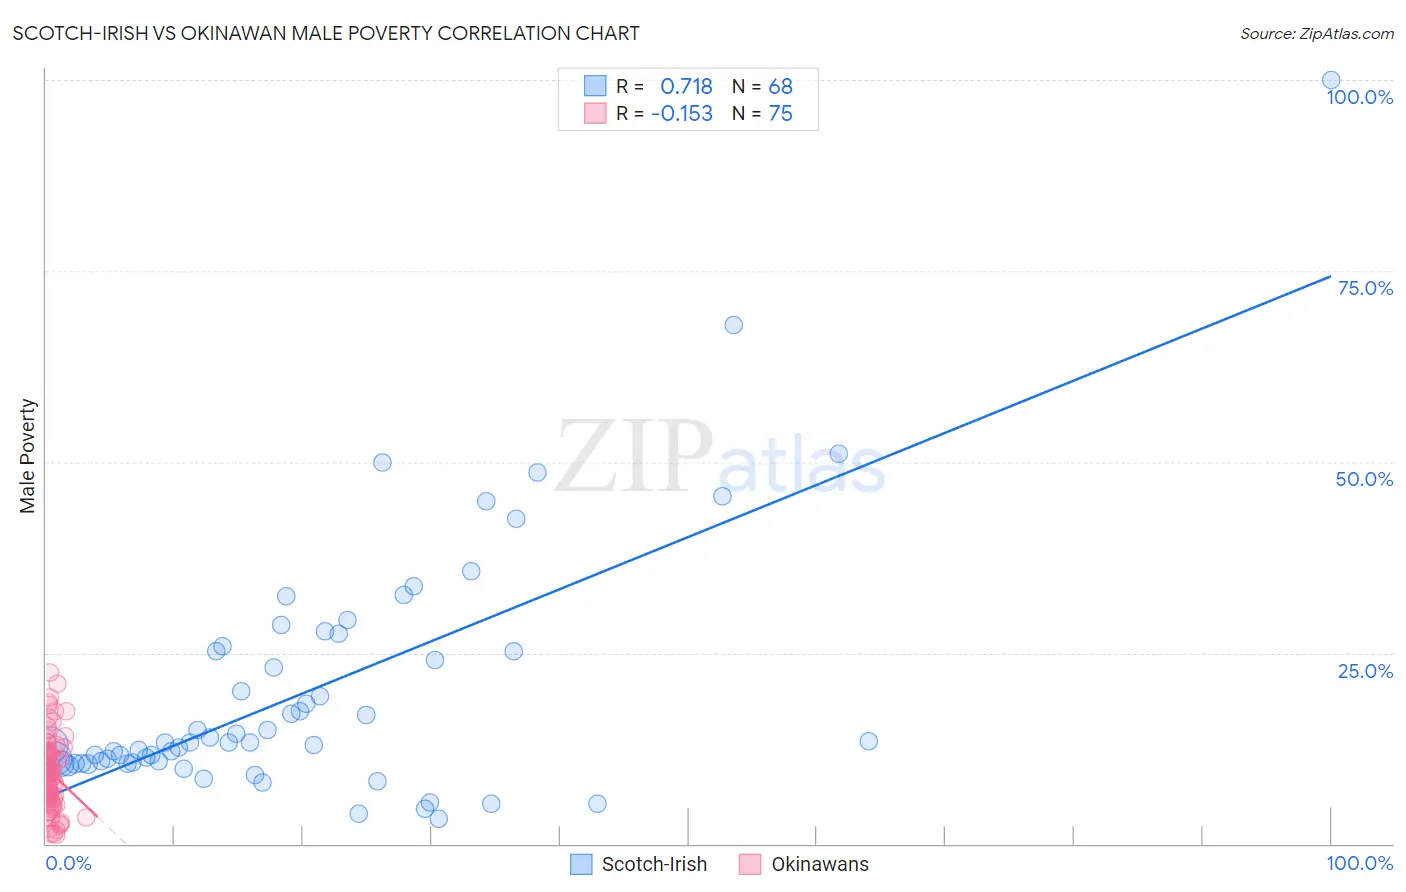
Scotch-Irish vs Okinawan Male Poverty Correlation Chart
The statistical analysis conducted on geographies consisting of 547,595,685 people shows a strong positive correlation between the proportion of Scotch-Irish and poverty level among males in the United States with a correlation coefficient (R) of 0.718 and weighted average of 11.0%. Similarly, the statistical analysis conducted on geographies consisting of 73,717,243 people shows a poor negative correlation between the proportion of Okinawans and poverty level among males in the United States with a correlation coefficient (R) of -0.153 and weighted average of 10.7%, a difference of 3.6%.
Male Poverty Correlation Summary
| Measurement | Scotch-Irish | Okinawan |
| Minimum | 3.2% | 1.2% |
| Maximum | 100.0% | 22.5% |
| Range | 96.8% | 21.3% |
| Mean | 20.1% | 9.2% |
| Median | 13.3% | 9.1% |
| Interquartile 25% (IQ1) | 10.6% | 5.5% |
| Interquartile 75% (IQ3) | 25.5% | 12.1% |
| Interquartile Range (IQR) | 14.9% | 6.6% |
| Standard Deviation (Sample) | 16.5% | 5.0% |
| Standard Deviation (Population) | 16.4% | 4.9% |
Similar Demographics by Male Poverty
Demographics Similar to Scotch-Irish by Male Poverty
In terms of male poverty, the demographic groups most similar to Scotch-Irish are Costa Rican (11.0%, a difference of 0.020%), Colombian (11.0%, a difference of 0.080%), Taiwanese (11.0%, a difference of 0.10%), Immigrants from Malaysia (11.0%, a difference of 0.11%), and Immigrants from Kazakhstan (11.0%, a difference of 0.12%).
| Demographics | Rating | Rank | Male Poverty |
| Guamanians/Chamorros | 67.6 /100 | #150 | Good 11.0% |
| Venezuelans | 67.4 /100 | #151 | Good 11.0% |
| Immigrants | Nepal | 67.3 /100 | #152 | Good 11.0% |
| Immigrants | Bosnia and Herzegovina | 65.2 /100 | #153 | Good 11.0% |
| Immigrants | Kazakhstan | 64.8 /100 | #154 | Good 11.0% |
| Immigrants | Malaysia | 64.7 /100 | #155 | Good 11.0% |
| Costa Ricans | 63.9 /100 | #156 | Good 11.0% |
| Scotch-Irish | 63.7 /100 | #157 | Good 11.0% |
| Colombians | 63.0 /100 | #158 | Good 11.0% |
| Taiwanese | 62.7 /100 | #159 | Good 11.0% |
| Soviet Union | 60.3 /100 | #160 | Good 11.1% |
| Immigrants | Northern Africa | 59.7 /100 | #161 | Average 11.1% |
| Immigrants | Chile | 57.4 /100 | #162 | Average 11.1% |
| Whites/Caucasians | 56.7 /100 | #163 | Average 11.1% |
| Ethiopians | 56.7 /100 | #164 | Average 11.1% |
Demographics Similar to Okinawans by Male Poverty
In terms of male poverty, the demographic groups most similar to Okinawans are Immigrants from Hungary (10.7%, a difference of 0.010%), Immigrants from South Eastern Asia (10.6%, a difference of 0.11%), Immigrants from China (10.7%, a difference of 0.11%), Sri Lankan (10.6%, a difference of 0.12%), and Peruvian (10.7%, a difference of 0.12%).
| Demographics | Rating | Rank | Male Poverty |
| Immigrants | Argentina | 89.8 /100 | #111 | Excellent 10.6% |
| Immigrants | Turkey | 89.5 /100 | #112 | Excellent 10.6% |
| Palestinians | 89.1 /100 | #113 | Excellent 10.6% |
| Immigrants | Brazil | 89.0 /100 | #114 | Excellent 10.6% |
| Immigrants | Russia | 88.6 /100 | #115 | Excellent 10.6% |
| Sri Lankans | 88.1 /100 | #116 | Excellent 10.6% |
| Immigrants | South Eastern Asia | 88.1 /100 | #117 | Excellent 10.6% |
| Okinawans | 87.6 /100 | #118 | Excellent 10.7% |
| Immigrants | Hungary | 87.6 /100 | #119 | Excellent 10.7% |
| Immigrants | China | 87.1 /100 | #120 | Excellent 10.7% |
| Peruvians | 87.1 /100 | #121 | Excellent 10.7% |
| Native Hawaiians | 87.0 /100 | #122 | Excellent 10.7% |
| South Africans | 86.8 /100 | #123 | Excellent 10.7% |
| French | 86.7 /100 | #124 | Excellent 10.7% |
| Immigrants | Norway | 86.0 /100 | #125 | Excellent 10.7% |