Immigrants from Serbia vs Maltese Householder Income Over 65 years
COMPARE
Immigrants from Serbia
Maltese
Householder Income Over 65 years
Householder Income Over 65 years Comparison
Immigrants from Serbia
Maltese
$63,387
HOUSEHOLDER INCOME OVER 65 YEARS
92.7/ 100
METRIC RATING
113th/ 347
METRIC RANK
$66,027
HOUSEHOLDER INCOME OVER 65 YEARS
99.5/ 100
METRIC RATING
61st/ 347
METRIC RANK
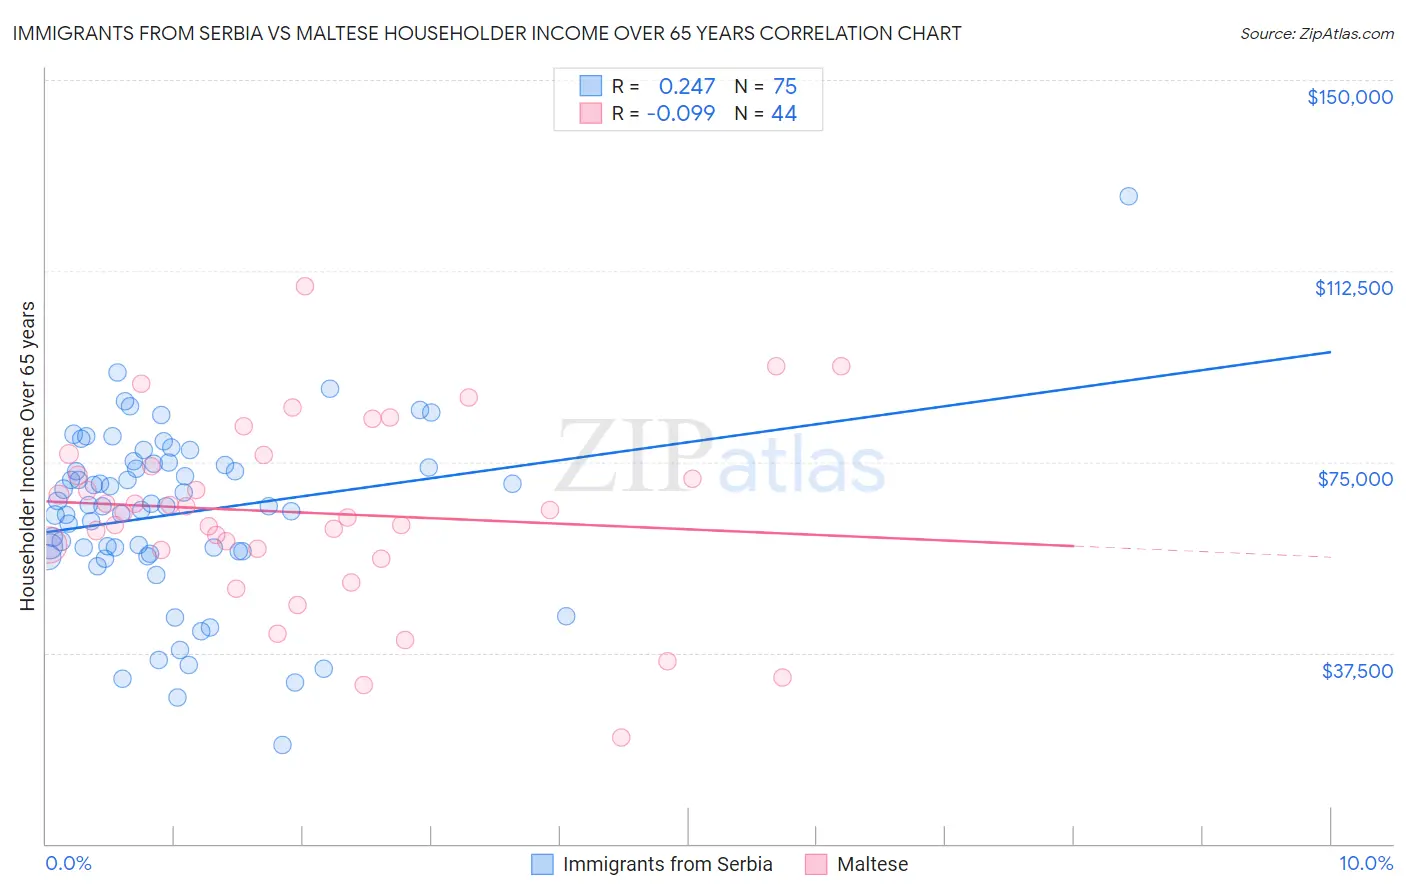
Immigrants from Serbia vs Maltese Householder Income Over 65 years Correlation Chart
The statistical analysis conducted on geographies consisting of 131,644,456 people shows a weak positive correlation between the proportion of Immigrants from Serbia and household income with householder over the age of 65 in the United States with a correlation coefficient (R) of 0.247 and weighted average of $63,387. Similarly, the statistical analysis conducted on geographies consisting of 126,350,499 people shows a slight negative correlation between the proportion of Maltese and household income with householder over the age of 65 in the United States with a correlation coefficient (R) of -0.099 and weighted average of $66,027, a difference of 4.2%.
Householder Income Over 65 years Correlation Summary
| Measurement | Immigrants from Serbia | Maltese |
| Minimum | $19,307 | $20,833 |
| Maximum | $127,250 | $109,444 |
| Range | $107,943 | $88,611 |
| Mean | $64,869 | $65,008 |
| Median | $66,375 | $65,396 |
| Interquartile 25% (IQ1) | $57,419 | $57,781 |
| Interquartile 75% (IQ3) | $74,688 | $75,260 |
| Interquartile Range (IQR) | $17,269 | $17,478 |
| Standard Deviation (Sample) | $17,146 | $18,003 |
| Standard Deviation (Population) | $17,032 | $17,797 |
Similar Demographics by Householder Income Over 65 years
Demographics Similar to Immigrants from Serbia by Householder Income Over 65 years
In terms of householder income over 65 years, the demographic groups most similar to Immigrants from Serbia are Immigrants from Saudi Arabia ($63,355, a difference of 0.050%), Syrian ($63,494, a difference of 0.17%), Immigrants from Spain ($63,540, a difference of 0.24%), Croatian ($63,225, a difference of 0.26%), and Guamanian/Chamorro ($63,187, a difference of 0.32%).
| Demographics | Rating | Rank | Householder Income Over 65 years |
| Immigrants | Argentina | 95.5 /100 | #106 | Exceptional $63,885 |
| Pakistanis | 95.3 /100 | #107 | Exceptional $63,844 |
| Palestinians | 95.1 /100 | #108 | Exceptional $63,800 |
| Europeans | 95.0 /100 | #109 | Exceptional $63,779 |
| Immigrants | Zimbabwe | 94.3 /100 | #110 | Exceptional $63,643 |
| Immigrants | Spain | 93.7 /100 | #111 | Exceptional $63,540 |
| Syrians | 93.4 /100 | #112 | Exceptional $63,494 |
| Immigrants | Serbia | 92.7 /100 | #113 | Exceptional $63,387 |
| Immigrants | Saudi Arabia | 92.4 /100 | #114 | Exceptional $63,355 |
| Croatians | 91.4 /100 | #115 | Exceptional $63,225 |
| Guamanians/Chamorros | 91.1 /100 | #116 | Exceptional $63,187 |
| Immigrants | Croatia | 90.9 /100 | #117 | Exceptional $63,168 |
| Danes | 90.5 /100 | #118 | Exceptional $63,117 |
| Immigrants | Jordan | 89.8 /100 | #119 | Excellent $63,041 |
| Ukrainians | 89.7 /100 | #120 | Excellent $63,032 |
Demographics Similar to Maltese by Householder Income Over 65 years
In terms of householder income over 65 years, the demographic groups most similar to Maltese are Immigrants from Sierra Leone ($66,009, a difference of 0.030%), Immigrants from Lithuania ($66,087, a difference of 0.090%), Immigrants from Norway ($66,118, a difference of 0.14%), Immigrants from Philippines ($66,161, a difference of 0.20%), and Marshallese ($65,874, a difference of 0.23%).
| Demographics | Rating | Rank | Householder Income Over 65 years |
| Immigrants | Netherlands | 99.7 /100 | #54 | Exceptional $66,463 |
| Immigrants | Czechoslovakia | 99.7 /100 | #55 | Exceptional $66,376 |
| Laotians | 99.6 /100 | #56 | Exceptional $66,306 |
| Bulgarians | 99.6 /100 | #57 | Exceptional $66,236 |
| Immigrants | Philippines | 99.6 /100 | #58 | Exceptional $66,161 |
| Immigrants | Norway | 99.5 /100 | #59 | Exceptional $66,118 |
| Immigrants | Lithuania | 99.5 /100 | #60 | Exceptional $66,087 |
| Maltese | 99.5 /100 | #61 | Exceptional $66,027 |
| Immigrants | Sierra Leone | 99.5 /100 | #62 | Exceptional $66,009 |
| Marshallese | 99.4 /100 | #63 | Exceptional $65,874 |
| Zimbabweans | 99.4 /100 | #64 | Exceptional $65,854 |
| Immigrants | England | 99.3 /100 | #65 | Exceptional $65,715 |
| South Africans | 99.3 /100 | #66 | Exceptional $65,652 |
| Immigrants | Malaysia | 99.1 /100 | #67 | Exceptional $65,497 |
| Egyptians | 99.1 /100 | #68 | Exceptional $65,441 |