Native/Alaskan vs Maltese Householder Income Over 65 years
COMPARE
Native/Alaskan
Maltese
Householder Income Over 65 years
Householder Income Over 65 years Comparison
Natives/Alaskans
Maltese
$52,081
HOUSEHOLDER INCOME OVER 65 YEARS
0.0/ 100
METRIC RATING
314th/ 347
METRIC RANK
$66,027
HOUSEHOLDER INCOME OVER 65 YEARS
99.5/ 100
METRIC RATING
61st/ 347
METRIC RANK
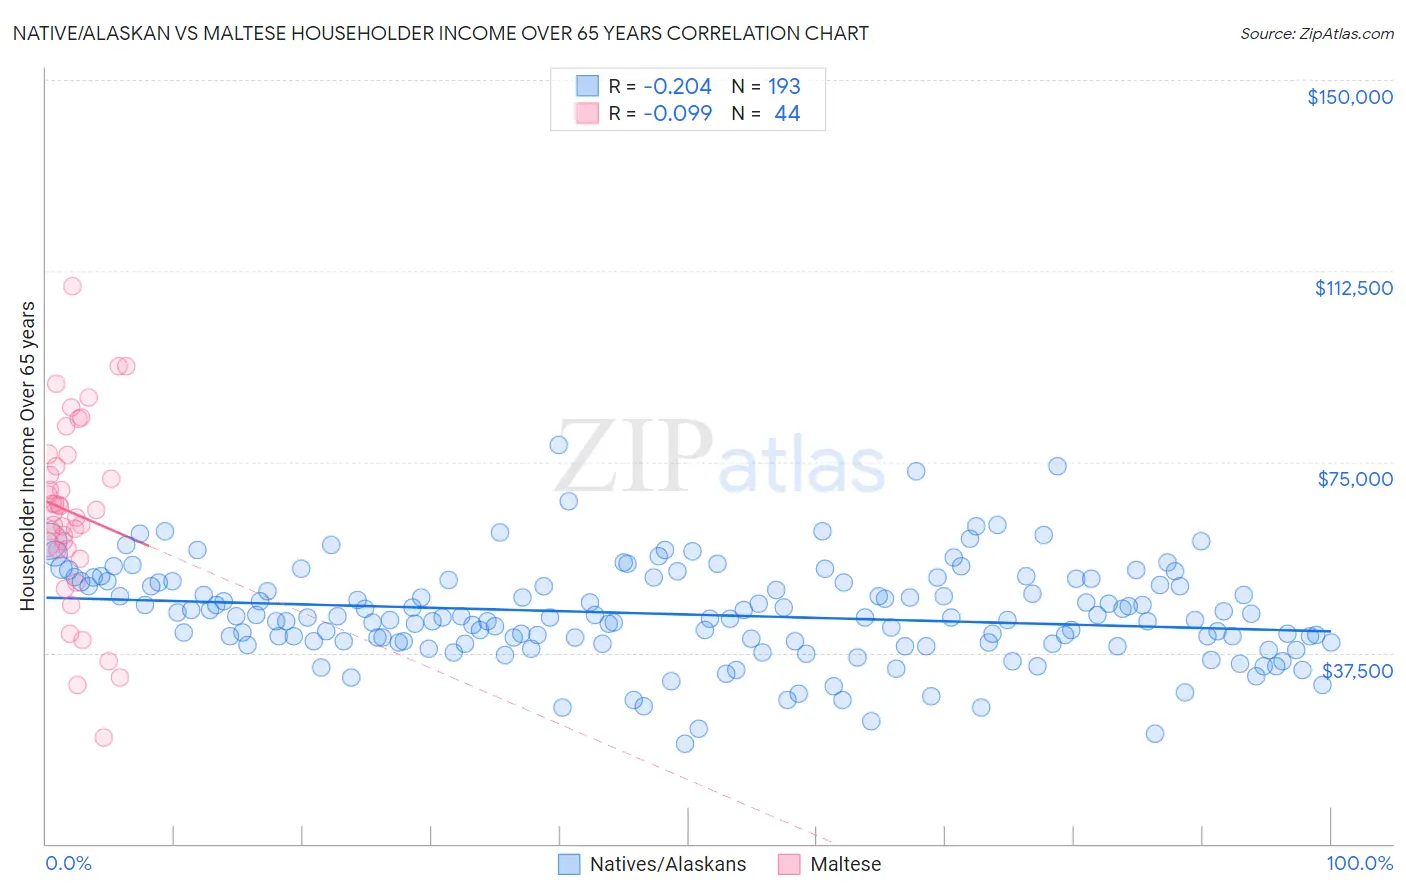
Native/Alaskan vs Maltese Householder Income Over 65 years Correlation Chart
The statistical analysis conducted on geographies consisting of 509,572,105 people shows a weak negative correlation between the proportion of Natives/Alaskans and household income with householder over the age of 65 in the United States with a correlation coefficient (R) of -0.204 and weighted average of $52,081. Similarly, the statistical analysis conducted on geographies consisting of 126,350,499 people shows a slight negative correlation between the proportion of Maltese and household income with householder over the age of 65 in the United States with a correlation coefficient (R) of -0.099 and weighted average of $66,027, a difference of 26.8%.
Householder Income Over 65 years Correlation Summary
| Measurement | Native/Alaskan | Maltese |
| Minimum | $19,554 | $20,833 |
| Maximum | $78,193 | $109,444 |
| Range | $58,639 | $88,611 |
| Mean | $45,041 | $65,008 |
| Median | $44,466 | $65,396 |
| Interquartile 25% (IQ1) | $39,545 | $57,781 |
| Interquartile 75% (IQ3) | $51,398 | $75,260 |
| Interquartile Range (IQR) | $11,852 | $17,478 |
| Standard Deviation (Sample) | $9,551 | $18,003 |
| Standard Deviation (Population) | $9,526 | $17,797 |
Similar Demographics by Householder Income Over 65 years
Demographics Similar to Natives/Alaskans by Householder Income Over 65 years
In terms of householder income over 65 years, the demographic groups most similar to Natives/Alaskans are Immigrants from Nicaragua ($52,085, a difference of 0.010%), U.S. Virgin Islander ($52,072, a difference of 0.020%), Immigrants from the Azores ($52,121, a difference of 0.080%), Creek ($51,949, a difference of 0.25%), and Immigrants from St. Vincent and the Grenadines ($51,922, a difference of 0.30%).
| Demographics | Rating | Rank | Householder Income Over 65 years |
| Hispanics or Latinos | 0.0 /100 | #307 | Tragic $52,832 |
| Immigrants | Mexico | 0.0 /100 | #308 | Tragic $52,801 |
| Hondurans | 0.0 /100 | #309 | Tragic $52,634 |
| Sioux | 0.0 /100 | #310 | Tragic $52,509 |
| Seminole | 0.0 /100 | #311 | Tragic $52,373 |
| Immigrants | Azores | 0.0 /100 | #312 | Tragic $52,121 |
| Immigrants | Nicaragua | 0.0 /100 | #313 | Tragic $52,085 |
| Natives/Alaskans | 0.0 /100 | #314 | Tragic $52,081 |
| U.S. Virgin Islanders | 0.0 /100 | #315 | Tragic $52,072 |
| Creek | 0.0 /100 | #316 | Tragic $51,949 |
| Immigrants | St. Vincent and the Grenadines | 0.0 /100 | #317 | Tragic $51,922 |
| Haitians | 0.0 /100 | #318 | Tragic $51,912 |
| Immigrants | Honduras | 0.0 /100 | #319 | Tragic $51,888 |
| Colville | 0.0 /100 | #320 | Tragic $51,739 |
| Menominee | 0.0 /100 | #321 | Tragic $51,719 |
Demographics Similar to Maltese by Householder Income Over 65 years
In terms of householder income over 65 years, the demographic groups most similar to Maltese are Immigrants from Sierra Leone ($66,009, a difference of 0.030%), Immigrants from Lithuania ($66,087, a difference of 0.090%), Immigrants from Norway ($66,118, a difference of 0.14%), Immigrants from Philippines ($66,161, a difference of 0.20%), and Marshallese ($65,874, a difference of 0.23%).
| Demographics | Rating | Rank | Householder Income Over 65 years |
| Immigrants | Netherlands | 99.7 /100 | #54 | Exceptional $66,463 |
| Immigrants | Czechoslovakia | 99.7 /100 | #55 | Exceptional $66,376 |
| Laotians | 99.6 /100 | #56 | Exceptional $66,306 |
| Bulgarians | 99.6 /100 | #57 | Exceptional $66,236 |
| Immigrants | Philippines | 99.6 /100 | #58 | Exceptional $66,161 |
| Immigrants | Norway | 99.5 /100 | #59 | Exceptional $66,118 |
| Immigrants | Lithuania | 99.5 /100 | #60 | Exceptional $66,087 |
| Maltese | 99.5 /100 | #61 | Exceptional $66,027 |
| Immigrants | Sierra Leone | 99.5 /100 | #62 | Exceptional $66,009 |
| Marshallese | 99.4 /100 | #63 | Exceptional $65,874 |
| Zimbabweans | 99.4 /100 | #64 | Exceptional $65,854 |
| Immigrants | England | 99.3 /100 | #65 | Exceptional $65,715 |
| South Africans | 99.3 /100 | #66 | Exceptional $65,652 |
| Immigrants | Malaysia | 99.1 /100 | #67 | Exceptional $65,497 |
| Egyptians | 99.1 /100 | #68 | Exceptional $65,441 |