Immigrants from Chile vs Maltese Householder Income Over 65 years
COMPARE
Immigrants from Chile
Maltese
Householder Income Over 65 years
Householder Income Over 65 years Comparison
Immigrants from Chile
Maltese
$62,354
HOUSEHOLDER INCOME OVER 65 YEARS
81.0/ 100
METRIC RATING
135th/ 347
METRIC RANK
$66,027
HOUSEHOLDER INCOME OVER 65 YEARS
99.5/ 100
METRIC RATING
61st/ 347
METRIC RANK
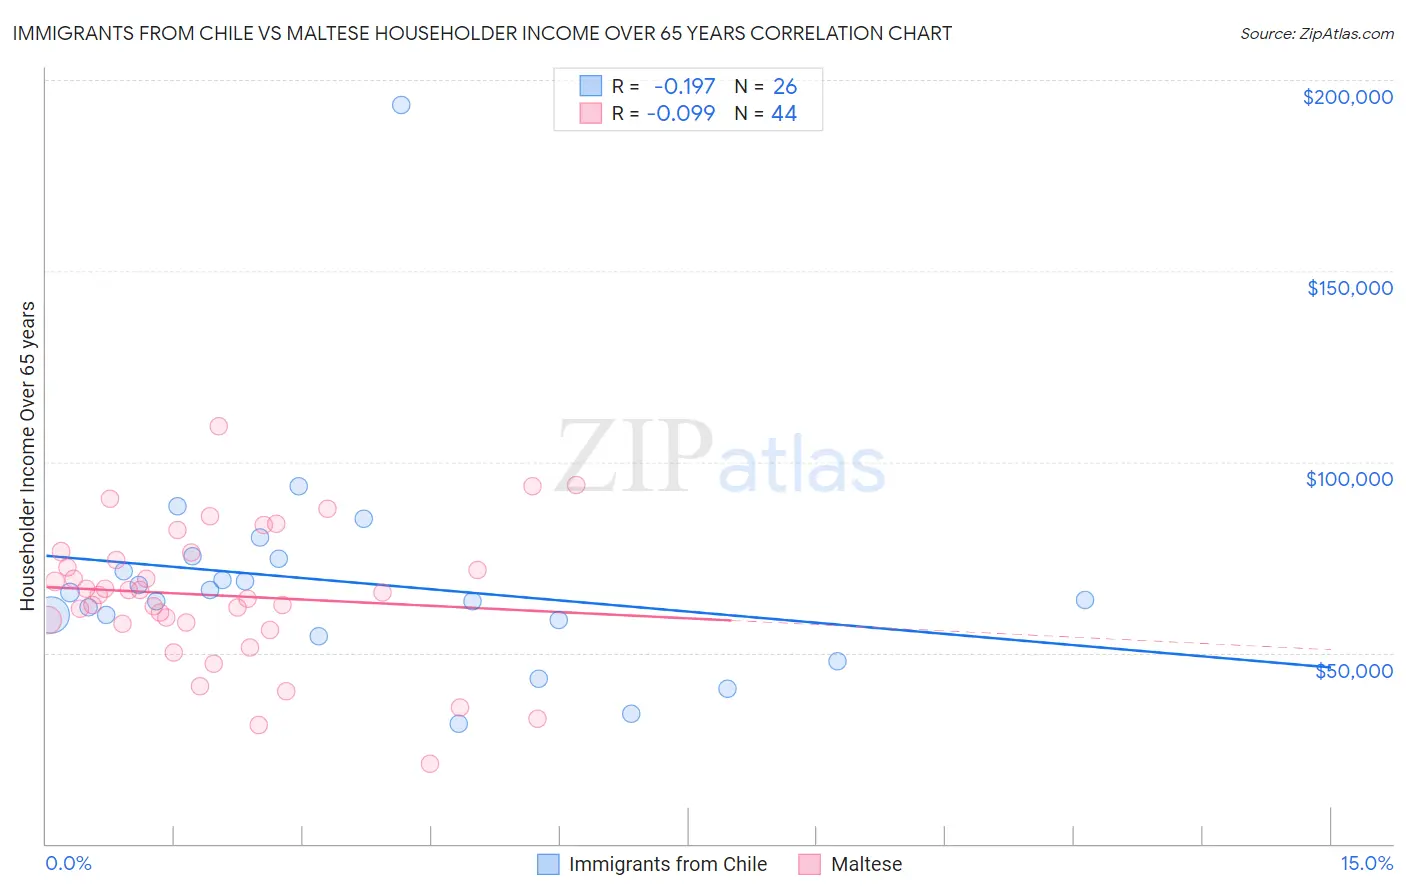
Immigrants from Chile vs Maltese Householder Income Over 65 years Correlation Chart
The statistical analysis conducted on geographies consisting of 218,471,340 people shows a poor negative correlation between the proportion of Immigrants from Chile and household income with householder over the age of 65 in the United States with a correlation coefficient (R) of -0.197 and weighted average of $62,354. Similarly, the statistical analysis conducted on geographies consisting of 126,350,499 people shows a slight negative correlation between the proportion of Maltese and household income with householder over the age of 65 in the United States with a correlation coefficient (R) of -0.099 and weighted average of $66,027, a difference of 5.9%.
Householder Income Over 65 years Correlation Summary
| Measurement | Immigrants from Chile | Maltese |
| Minimum | $31,406 | $20,833 |
| Maximum | $193,611 | $109,444 |
| Range | $162,205 | $88,611 |
| Mean | $68,575 | $65,008 |
| Median | $64,728 | $65,396 |
| Interquartile 25% (IQ1) | $58,558 | $57,781 |
| Interquartile 75% (IQ3) | $74,792 | $75,260 |
| Interquartile Range (IQR) | $16,234 | $17,478 |
| Standard Deviation (Sample) | $29,777 | $18,003 |
| Standard Deviation (Population) | $29,198 | $17,797 |
Similar Demographics by Householder Income Over 65 years
Demographics Similar to Immigrants from Chile by Householder Income Over 65 years
In terms of householder income over 65 years, the demographic groups most similar to Immigrants from Chile are Immigrants from Brazil ($62,364, a difference of 0.020%), Alaskan Athabascan ($62,330, a difference of 0.040%), Immigrants from Syria ($62,303, a difference of 0.080%), Immigrants from Kazakhstan ($62,292, a difference of 0.10%), and Lebanese ($62,287, a difference of 0.11%).
| Demographics | Rating | Rank | Householder Income Over 65 years |
| Aleuts | 86.1 /100 | #128 | Excellent $62,708 |
| Immigrants | Eastern Europe | 85.9 /100 | #129 | Excellent $62,693 |
| Basques | 85.4 /100 | #130 | Excellent $62,653 |
| Immigrants | Western Asia | 85.3 /100 | #131 | Excellent $62,645 |
| Immigrants | Germany | 83.9 /100 | #132 | Excellent $62,544 |
| Immigrants | Northern Africa | 83.6 /100 | #133 | Excellent $62,522 |
| Immigrants | Brazil | 81.2 /100 | #134 | Excellent $62,364 |
| Immigrants | Chile | 81.0 /100 | #135 | Excellent $62,354 |
| Alaskan Athabascans | 80.6 /100 | #136 | Excellent $62,330 |
| Immigrants | Syria | 80.2 /100 | #137 | Excellent $62,303 |
| Immigrants | Kazakhstan | 80.0 /100 | #138 | Excellent $62,292 |
| Lebanese | 79.9 /100 | #139 | Good $62,287 |
| Arabs | 79.6 /100 | #140 | Good $62,266 |
| Canadians | 79.0 /100 | #141 | Good $62,230 |
| South American Indians | 78.7 /100 | #142 | Good $62,215 |
Demographics Similar to Maltese by Householder Income Over 65 years
In terms of householder income over 65 years, the demographic groups most similar to Maltese are Immigrants from Sierra Leone ($66,009, a difference of 0.030%), Immigrants from Lithuania ($66,087, a difference of 0.090%), Immigrants from Norway ($66,118, a difference of 0.14%), Immigrants from Philippines ($66,161, a difference of 0.20%), and Marshallese ($65,874, a difference of 0.23%).
| Demographics | Rating | Rank | Householder Income Over 65 years |
| Immigrants | Netherlands | 99.7 /100 | #54 | Exceptional $66,463 |
| Immigrants | Czechoslovakia | 99.7 /100 | #55 | Exceptional $66,376 |
| Laotians | 99.6 /100 | #56 | Exceptional $66,306 |
| Bulgarians | 99.6 /100 | #57 | Exceptional $66,236 |
| Immigrants | Philippines | 99.6 /100 | #58 | Exceptional $66,161 |
| Immigrants | Norway | 99.5 /100 | #59 | Exceptional $66,118 |
| Immigrants | Lithuania | 99.5 /100 | #60 | Exceptional $66,087 |
| Maltese | 99.5 /100 | #61 | Exceptional $66,027 |
| Immigrants | Sierra Leone | 99.5 /100 | #62 | Exceptional $66,009 |
| Marshallese | 99.4 /100 | #63 | Exceptional $65,874 |
| Zimbabweans | 99.4 /100 | #64 | Exceptional $65,854 |
| Immigrants | England | 99.3 /100 | #65 | Exceptional $65,715 |
| South Africans | 99.3 /100 | #66 | Exceptional $65,652 |
| Immigrants | Malaysia | 99.1 /100 | #67 | Exceptional $65,497 |
| Egyptians | 99.1 /100 | #68 | Exceptional $65,441 |