Turkish vs Cambodian Householder Income Over 65 years
COMPARE
Turkish
Cambodian
Householder Income Over 65 years
Householder Income Over 65 years Comparison
Turks
Cambodians
$68,037
HOUSEHOLDER INCOME OVER 65 YEARS
99.9/ 100
METRIC RATING
37th/ 347
METRIC RANK
$66,892
HOUSEHOLDER INCOME OVER 65 YEARS
99.8/ 100
METRIC RATING
46th/ 347
METRIC RANK
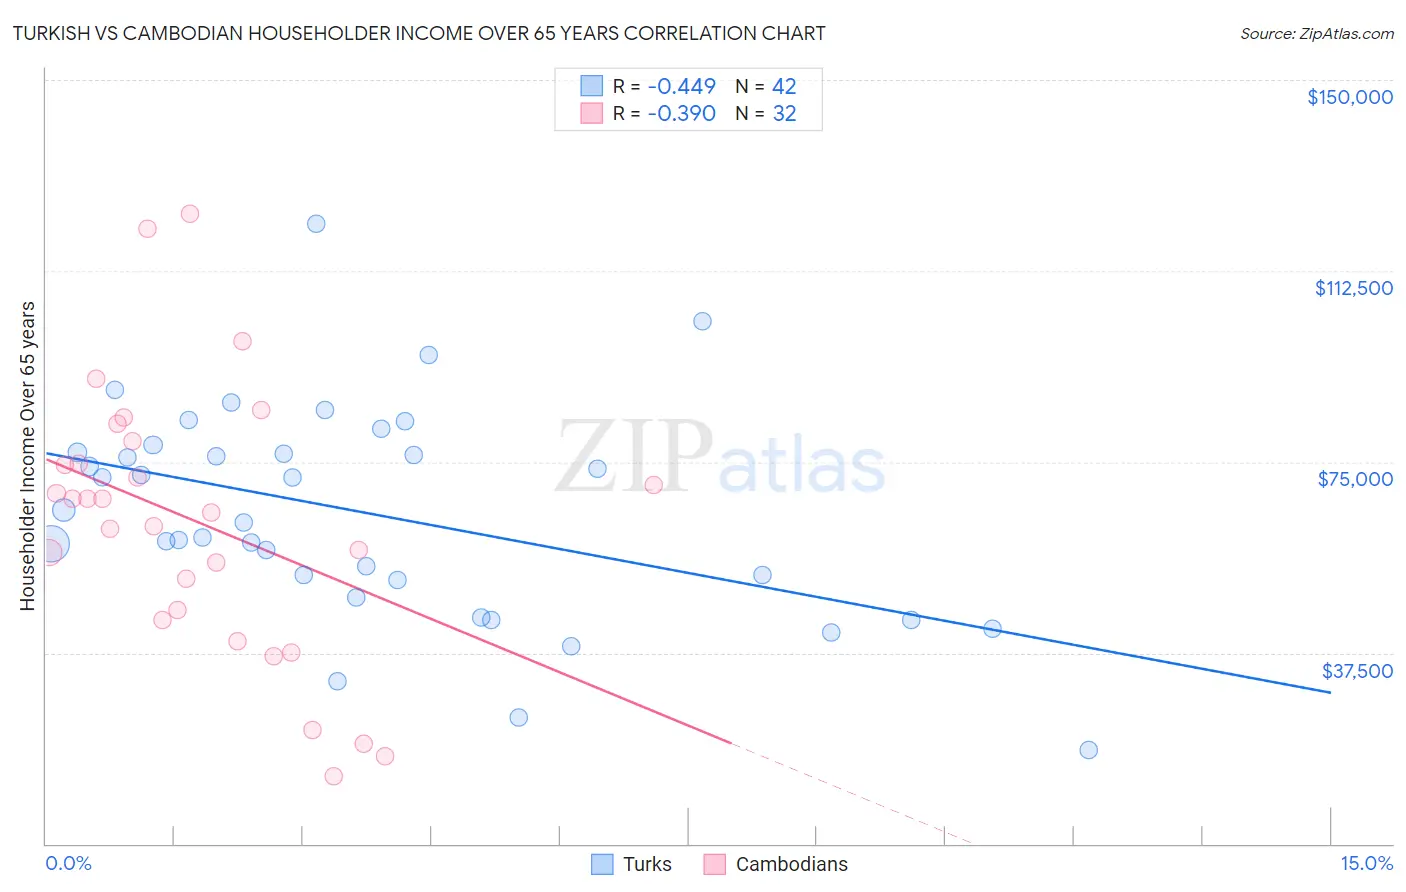
Turkish vs Cambodian Householder Income Over 65 years Correlation Chart
The statistical analysis conducted on geographies consisting of 271,295,449 people shows a moderate negative correlation between the proportion of Turks and household income with householder over the age of 65 in the United States with a correlation coefficient (R) of -0.449 and weighted average of $68,037. Similarly, the statistical analysis conducted on geographies consisting of 102,372,212 people shows a mild negative correlation between the proportion of Cambodians and household income with householder over the age of 65 in the United States with a correlation coefficient (R) of -0.390 and weighted average of $66,892, a difference of 1.7%.
Householder Income Over 65 years Correlation Summary
| Measurement | Turkish | Cambodian |
| Minimum | $18,472 | $13,250 |
| Maximum | $121,806 | $123,750 |
| Range | $103,334 | $110,500 |
| Mean | $64,935 | $63,009 |
| Median | $64,229 | $66,420 |
| Interquartile 25% (IQ1) | $51,875 | $44,945 |
| Interquartile 75% (IQ3) | $76,840 | $76,799 |
| Interquartile Range (IQR) | $24,964 | $31,853 |
| Standard Deviation (Sample) | $21,025 | $26,681 |
| Standard Deviation (Population) | $20,773 | $26,261 |
Demographics Similar to Turks and Cambodians by Householder Income Over 65 years
In terms of householder income over 65 years, the demographic groups most similar to Turks are Estonian ($67,926, a difference of 0.16%), Immigrants from Austria ($68,208, a difference of 0.25%), Tongan ($68,235, a difference of 0.29%), Russian ($67,626, a difference of 0.61%), and Immigrants from Asia ($67,594, a difference of 0.66%). Similarly, the demographic groups most similar to Cambodians are Australian ($66,891, a difference of 0.0%), Immigrants from France ($66,826, a difference of 0.10%), Immigrants from Afghanistan ($67,007, a difference of 0.17%), Immigrants from Indonesia ($66,694, a difference of 0.30%), and Immigrants from Turkey ($66,672, a difference of 0.33%).
| Demographics | Rating | Rank | Householder Income Over 65 years |
| Afghans | 100.0 /100 | #31 | Exceptional $68,951 |
| Asians | 100.0 /100 | #32 | Exceptional $68,822 |
| Immigrants | Denmark | 100.0 /100 | #33 | Exceptional $68,801 |
| Immigrants | Ireland | 100.0 /100 | #34 | Exceptional $68,495 |
| Tongans | 100.0 /100 | #35 | Exceptional $68,235 |
| Immigrants | Austria | 99.9 /100 | #36 | Exceptional $68,208 |
| Turks | 99.9 /100 | #37 | Exceptional $68,037 |
| Estonians | 99.9 /100 | #38 | Exceptional $67,926 |
| Russians | 99.9 /100 | #39 | Exceptional $67,626 |
| Immigrants | Asia | 99.9 /100 | #40 | Exceptional $67,594 |
| Koreans | 99.9 /100 | #41 | Exceptional $67,472 |
| New Zealanders | 99.9 /100 | #42 | Exceptional $67,333 |
| Latvians | 99.9 /100 | #43 | Exceptional $67,326 |
| Immigrants | South Africa | 99.9 /100 | #44 | Exceptional $67,234 |
| Immigrants | Afghanistan | 99.8 /100 | #45 | Exceptional $67,007 |
| Cambodians | 99.8 /100 | #46 | Exceptional $66,892 |
| Australians | 99.8 /100 | #47 | Exceptional $66,891 |
| Immigrants | France | 99.8 /100 | #48 | Exceptional $66,826 |
| Immigrants | Indonesia | 99.8 /100 | #49 | Exceptional $66,694 |
| Immigrants | Turkey | 99.7 /100 | #50 | Exceptional $66,672 |
| Israelis | 99.7 /100 | #51 | Exceptional $66,636 |