Scotch-Irish vs Cambodian Male Unemployment
COMPARE
Scotch-Irish
Cambodian
Male Unemployment
Male Unemployment Comparison
Scotch-Irish
Cambodians
4.9%
MALE UNEMPLOYMENT
99.4/ 100
METRIC RATING
37th/ 347
METRIC RANK
5.0%
MALE UNEMPLOYMENT
98.1/ 100
METRIC RATING
61st/ 347
METRIC RANK
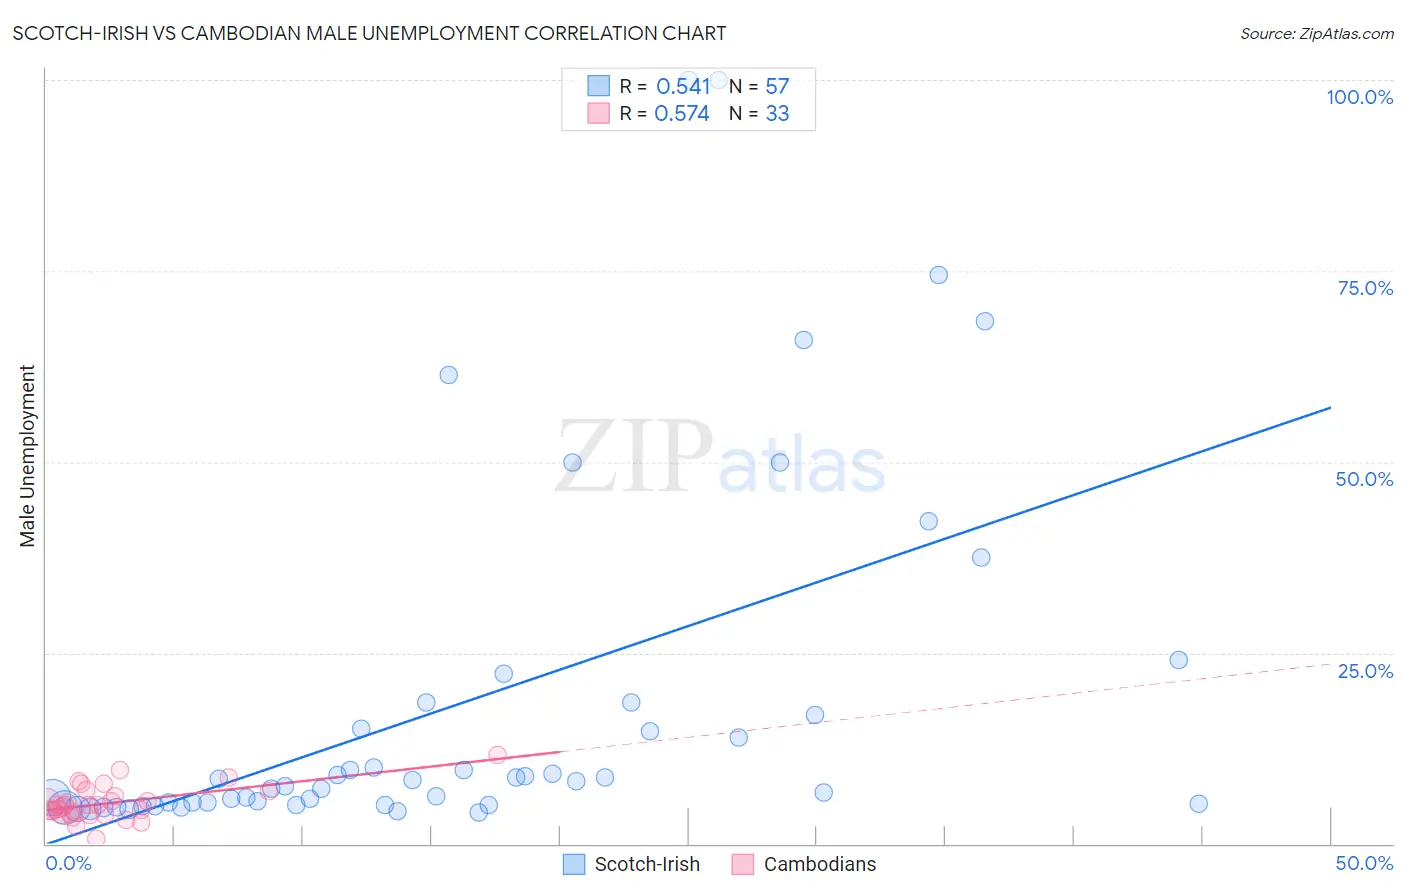
Scotch-Irish vs Cambodian Male Unemployment Correlation Chart
The statistical analysis conducted on geographies consisting of 539,618,671 people shows a substantial positive correlation between the proportion of Scotch-Irish and unemployment rate among males in the United States with a correlation coefficient (R) of 0.541 and weighted average of 4.9%. Similarly, the statistical analysis conducted on geographies consisting of 102,427,850 people shows a substantial positive correlation between the proportion of Cambodians and unemployment rate among males in the United States with a correlation coefficient (R) of 0.574 and weighted average of 5.0%, a difference of 1.8%.
Male Unemployment Correlation Summary
| Measurement | Scotch-Irish | Cambodian |
| Minimum | 4.1% | 0.70% |
| Maximum | 100.0% | 11.6% |
| Range | 95.9% | 10.9% |
| Mean | 18.3% | 5.3% |
| Median | 8.2% | 5.0% |
| Interquartile 25% (IQ1) | 5.2% | 3.9% |
| Interquartile 75% (IQ3) | 17.7% | 6.6% |
| Interquartile Range (IQR) | 12.5% | 2.6% |
| Standard Deviation (Sample) | 23.8% | 2.2% |
| Standard Deviation (Population) | 23.6% | 2.2% |
Similar Demographics by Male Unemployment
Demographics Similar to Scotch-Irish by Male Unemployment
In terms of male unemployment, the demographic groups most similar to Scotch-Irish are Immigrants from Bosnia and Herzegovina (4.9%, a difference of 0.020%), Burmese (4.9%, a difference of 0.090%), Northern European (4.9%, a difference of 0.17%), Immigrants from Singapore (4.9%, a difference of 0.21%), and Chinese (4.9%, a difference of 0.26%).
| Demographics | Rating | Rank | Male Unemployment |
| British | 99.8 /100 | #30 | Exceptional 4.8% |
| Sudanese | 99.8 /100 | #31 | Exceptional 4.8% |
| Immigrants | Nepal | 99.8 /100 | #32 | Exceptional 4.8% |
| Latvians | 99.7 /100 | #33 | Exceptional 4.8% |
| Welsh | 99.7 /100 | #34 | Exceptional 4.8% |
| Paraguayans | 99.5 /100 | #35 | Exceptional 4.9% |
| Immigrants | Singapore | 99.4 /100 | #36 | Exceptional 4.9% |
| Scotch-Irish | 99.4 /100 | #37 | Exceptional 4.9% |
| Immigrants | Bosnia and Herzegovina | 99.4 /100 | #38 | Exceptional 4.9% |
| Burmese | 99.3 /100 | #39 | Exceptional 4.9% |
| Northern Europeans | 99.3 /100 | #40 | Exceptional 4.9% |
| Chinese | 99.3 /100 | #41 | Exceptional 4.9% |
| Immigrants | Belgium | 99.2 /100 | #42 | Exceptional 4.9% |
| Immigrants | Japan | 99.2 /100 | #43 | Exceptional 4.9% |
| Immigrants | Korea | 99.1 /100 | #44 | Exceptional 4.9% |
Demographics Similar to Cambodians by Male Unemployment
In terms of male unemployment, the demographic groups most similar to Cambodians are Immigrants from Argentina (5.0%, a difference of 0.080%), Basque (5.0%, a difference of 0.13%), Eastern European (5.0%, a difference of 0.14%), Celtic (5.0%, a difference of 0.16%), and Immigrants from Netherlands (5.0%, a difference of 0.26%).
| Demographics | Rating | Rank | Male Unemployment |
| Yugoslavians | 98.7 /100 | #54 | Exceptional 5.0% |
| Czechoslovakians | 98.7 /100 | #55 | Exceptional 5.0% |
| Immigrants | Bulgaria | 98.7 /100 | #56 | Exceptional 5.0% |
| Turks | 98.5 /100 | #57 | Exceptional 5.0% |
| Lithuanians | 98.5 /100 | #58 | Exceptional 5.0% |
| Immigrants | Netherlands | 98.3 /100 | #59 | Exceptional 5.0% |
| Immigrants | Argentina | 98.1 /100 | #60 | Exceptional 5.0% |
| Cambodians | 98.1 /100 | #61 | Exceptional 5.0% |
| Basques | 97.9 /100 | #62 | Exceptional 5.0% |
| Eastern Europeans | 97.9 /100 | #63 | Exceptional 5.0% |
| Celtics | 97.8 /100 | #64 | Exceptional 5.0% |
| Icelanders | 97.6 /100 | #65 | Exceptional 5.0% |
| Finns | 97.5 /100 | #66 | Exceptional 5.0% |
| Immigrants | Canada | 97.5 /100 | #67 | Exceptional 5.0% |
| Australians | 97.4 /100 | #68 | Exceptional 5.0% |