Jamaican vs Bangladeshi Householder Income Over 65 years
COMPARE
Jamaican
Bangladeshi
Householder Income Over 65 years
Householder Income Over 65 years Comparison
Jamaicans
Bangladeshis
$54,560
HOUSEHOLDER INCOME OVER 65 YEARS
0.1/ 100
METRIC RATING
266th/ 347
METRIC RANK
$54,719
HOUSEHOLDER INCOME OVER 65 YEARS
0.1/ 100
METRIC RATING
262nd/ 347
METRIC RANK
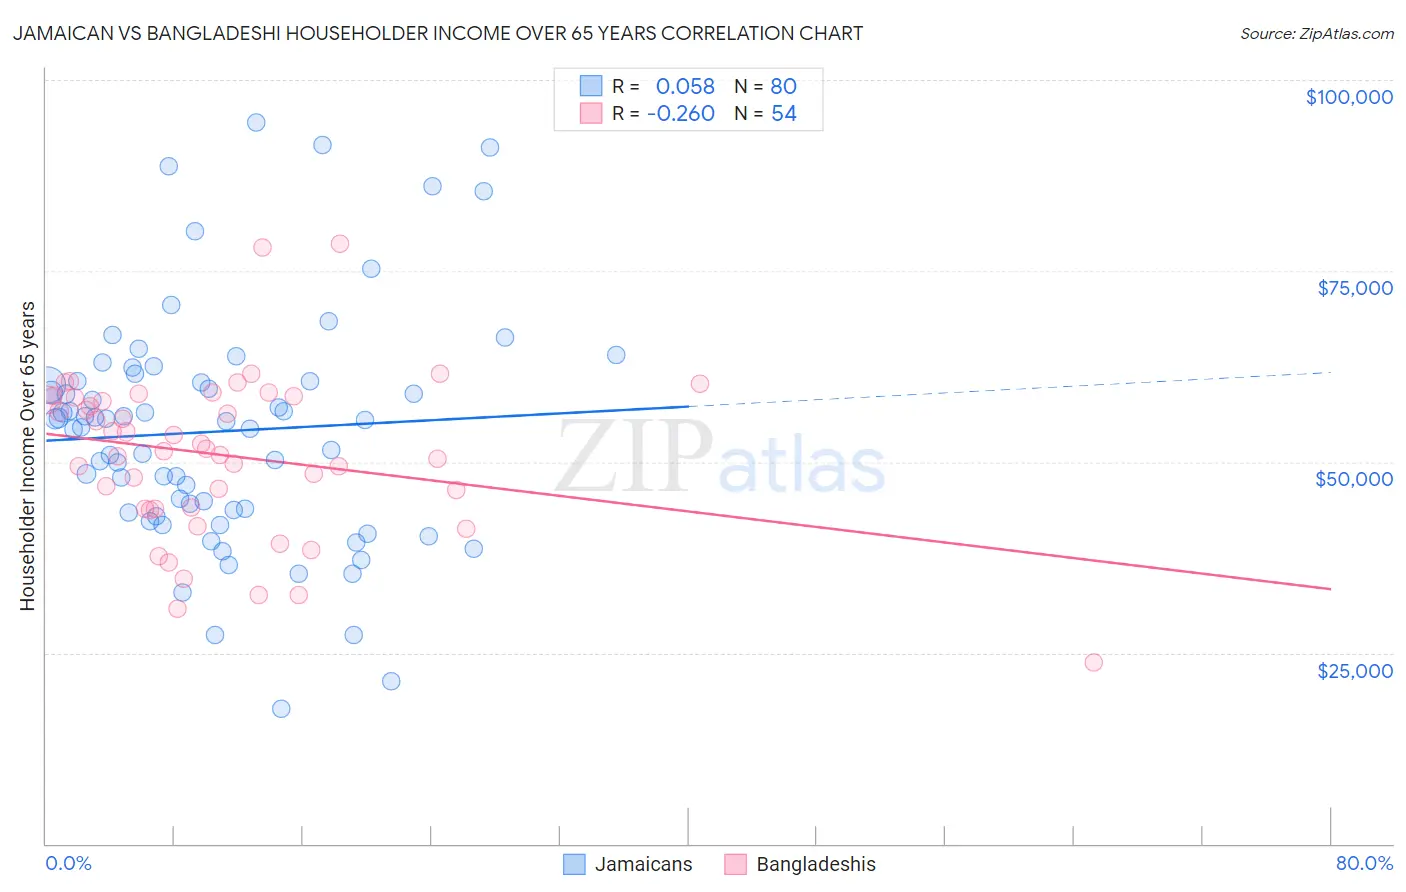
Jamaican vs Bangladeshi Householder Income Over 65 years Correlation Chart
The statistical analysis conducted on geographies consisting of 366,342,723 people shows a slight positive correlation between the proportion of Jamaicans and household income with householder over the age of 65 in the United States with a correlation coefficient (R) of 0.058 and weighted average of $54,560. Similarly, the statistical analysis conducted on geographies consisting of 140,913,932 people shows a weak negative correlation between the proportion of Bangladeshis and household income with householder over the age of 65 in the United States with a correlation coefficient (R) of -0.260 and weighted average of $54,719, a difference of 0.29%.
Householder Income Over 65 years Correlation Summary
| Measurement | Jamaican | Bangladeshi |
| Minimum | $17,596 | $23,750 |
| Maximum | $94,474 | $78,500 |
| Range | $76,878 | $54,750 |
| Mean | $53,994 | $50,859 |
| Median | $55,397 | $51,575 |
| Interquartile 25% (IQ1) | $43,595 | $43,904 |
| Interquartile 75% (IQ3) | $60,577 | $58,421 |
| Interquartile Range (IQR) | $16,982 | $14,517 |
| Standard Deviation (Sample) | $15,398 | $10,619 |
| Standard Deviation (Population) | $15,302 | $10,520 |
Demographics Similar to Jamaicans and Bangladeshis by Householder Income Over 65 years
In terms of householder income over 65 years, the demographic groups most similar to Jamaicans are Belizean ($54,580, a difference of 0.040%), Guatemalan ($54,526, a difference of 0.060%), Immigrants from Zaire ($54,512, a difference of 0.090%), Nicaraguan ($54,474, a difference of 0.16%), and Apache ($54,668, a difference of 0.20%). Similarly, the demographic groups most similar to Bangladeshis are French American Indian ($54,699, a difference of 0.040%), Apache ($54,668, a difference of 0.090%), Belizean ($54,580, a difference of 0.25%), Guatemalan ($54,526, a difference of 0.35%), and Comanche ($54,922, a difference of 0.37%).
| Demographics | Rating | Rank | Householder Income Over 65 years |
| Americans | 0.3 /100 | #254 | Tragic $55,527 |
| Immigrants | Bangladesh | 0.3 /100 | #255 | Tragic $55,394 |
| German Russians | 0.3 /100 | #256 | Tragic $55,356 |
| Trinidadians and Tobagonians | 0.3 /100 | #257 | Tragic $55,327 |
| Ecuadorians | 0.2 /100 | #258 | Tragic $54,958 |
| West Indians | 0.2 /100 | #259 | Tragic $54,936 |
| Immigrants | West Indies | 0.2 /100 | #260 | Tragic $54,927 |
| Comanche | 0.2 /100 | #261 | Tragic $54,922 |
| Bangladeshis | 0.1 /100 | #262 | Tragic $54,719 |
| French American Indians | 0.1 /100 | #263 | Tragic $54,699 |
| Apache | 0.1 /100 | #264 | Tragic $54,668 |
| Belizeans | 0.1 /100 | #265 | Tragic $54,580 |
| Jamaicans | 0.1 /100 | #266 | Tragic $54,560 |
| Guatemalans | 0.1 /100 | #267 | Tragic $54,526 |
| Immigrants | Zaire | 0.1 /100 | #268 | Tragic $54,512 |
| Nicaraguans | 0.1 /100 | #269 | Tragic $54,474 |
| Immigrants | Senegal | 0.1 /100 | #270 | Tragic $54,447 |
| Liberians | 0.1 /100 | #271 | Tragic $54,356 |
| Potawatomi | 0.1 /100 | #272 | Tragic $54,212 |
| Indonesians | 0.1 /100 | #273 | Tragic $54,176 |
| Barbadians | 0.1 /100 | #274 | Tragic $54,163 |