Yakama vs Bangladeshi Householder Income Over 65 years
COMPARE
Yakama
Bangladeshi
Householder Income Over 65 years
Householder Income Over 65 years Comparison
Yakama
Bangladeshis
$56,234
HOUSEHOLDER INCOME OVER 65 YEARS
0.7/ 100
METRIC RATING
247th/ 347
METRIC RANK
$54,719
HOUSEHOLDER INCOME OVER 65 YEARS
0.1/ 100
METRIC RATING
262nd/ 347
METRIC RANK
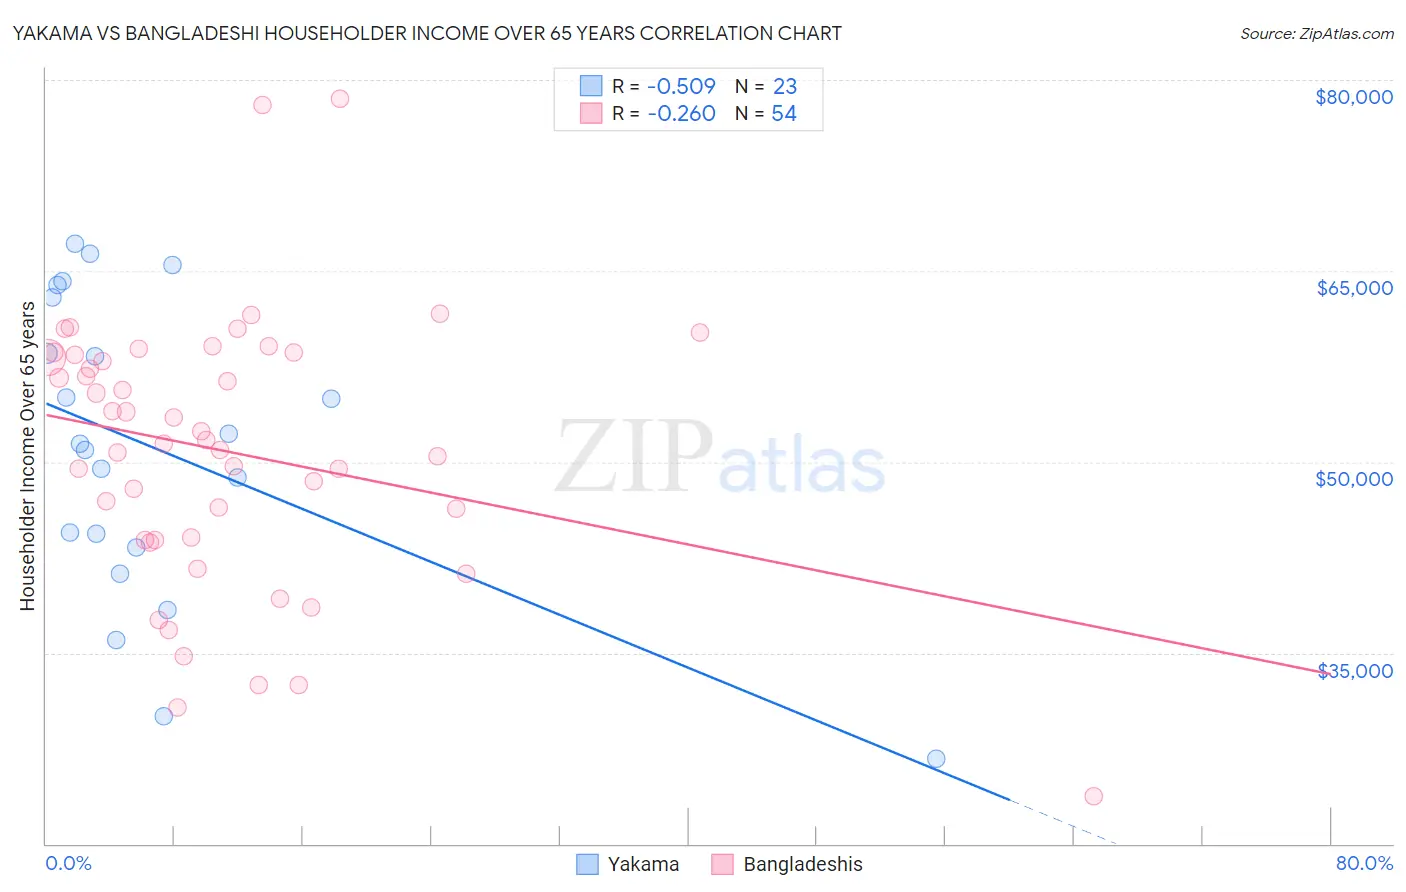
Yakama vs Bangladeshi Householder Income Over 65 years Correlation Chart
The statistical analysis conducted on geographies consisting of 19,889,958 people shows a substantial negative correlation between the proportion of Yakama and household income with householder over the age of 65 in the United States with a correlation coefficient (R) of -0.509 and weighted average of $56,234. Similarly, the statistical analysis conducted on geographies consisting of 140,913,932 people shows a weak negative correlation between the proportion of Bangladeshis and household income with householder over the age of 65 in the United States with a correlation coefficient (R) of -0.260 and weighted average of $54,719, a difference of 2.8%.
Householder Income Over 65 years Correlation Summary
| Measurement | Yakama | Bangladeshi |
| Minimum | $26,667 | $23,750 |
| Maximum | $67,099 | $78,500 |
| Range | $40,432 | $54,750 |
| Mean | $51,039 | $50,859 |
| Median | $51,401 | $51,575 |
| Interquartile 25% (IQ1) | $43,321 | $43,904 |
| Interquartile 75% (IQ3) | $62,905 | $58,421 |
| Interquartile Range (IQR) | $19,584 | $14,517 |
| Standard Deviation (Sample) | $11,672 | $10,619 |
| Standard Deviation (Population) | $11,415 | $10,520 |
Demographics Similar to Yakama and Bangladeshis by Householder Income Over 65 years
In terms of householder income over 65 years, the demographic groups most similar to Yakama are Central American ($56,321, a difference of 0.15%), Vietnamese ($56,143, a difference of 0.16%), Immigrants from Uzbekistan ($56,331, a difference of 0.17%), Hmong ($56,339, a difference of 0.19%), and Mexican American Indian ($56,089, a difference of 0.26%). Similarly, the demographic groups most similar to Bangladeshis are French American Indian ($54,699, a difference of 0.040%), Apache ($54,668, a difference of 0.090%), Comanche ($54,922, a difference of 0.37%), Immigrants from West Indies ($54,927, a difference of 0.38%), and West Indian ($54,936, a difference of 0.40%).
| Demographics | Rating | Rank | Householder Income Over 65 years |
| Hmong | 0.8 /100 | #244 | Tragic $56,339 |
| Immigrants | Uzbekistan | 0.8 /100 | #245 | Tragic $56,331 |
| Central Americans | 0.8 /100 | #246 | Tragic $56,321 |
| Yakama | 0.7 /100 | #247 | Tragic $56,234 |
| Vietnamese | 0.6 /100 | #248 | Tragic $56,143 |
| Mexican American Indians | 0.6 /100 | #249 | Tragic $56,089 |
| Immigrants | Bosnia and Herzegovina | 0.5 /100 | #250 | Tragic $55,986 |
| Immigrants | Portugal | 0.5 /100 | #251 | Tragic $55,924 |
| Osage | 0.4 /100 | #252 | Tragic $55,677 |
| Immigrants | Trinidad and Tobago | 0.4 /100 | #253 | Tragic $55,598 |
| Americans | 0.3 /100 | #254 | Tragic $55,527 |
| Immigrants | Bangladesh | 0.3 /100 | #255 | Tragic $55,394 |
| German Russians | 0.3 /100 | #256 | Tragic $55,356 |
| Trinidadians and Tobagonians | 0.3 /100 | #257 | Tragic $55,327 |
| Ecuadorians | 0.2 /100 | #258 | Tragic $54,958 |
| West Indians | 0.2 /100 | #259 | Tragic $54,936 |
| Immigrants | West Indies | 0.2 /100 | #260 | Tragic $54,927 |
| Comanche | 0.2 /100 | #261 | Tragic $54,922 |
| Bangladeshis | 0.1 /100 | #262 | Tragic $54,719 |
| French American Indians | 0.1 /100 | #263 | Tragic $54,699 |
| Apache | 0.1 /100 | #264 | Tragic $54,668 |