Salvadoran vs Bangladeshi Householder Income Over 65 years
COMPARE
Salvadoran
Bangladeshi
Householder Income Over 65 years
Householder Income Over 65 years Comparison
Salvadorans
Bangladeshis
$59,141
HOUSEHOLDER INCOME OVER 65 YEARS
12.9/ 100
METRIC RATING
207th/ 347
METRIC RANK
$54,719
HOUSEHOLDER INCOME OVER 65 YEARS
0.1/ 100
METRIC RATING
262nd/ 347
METRIC RANK
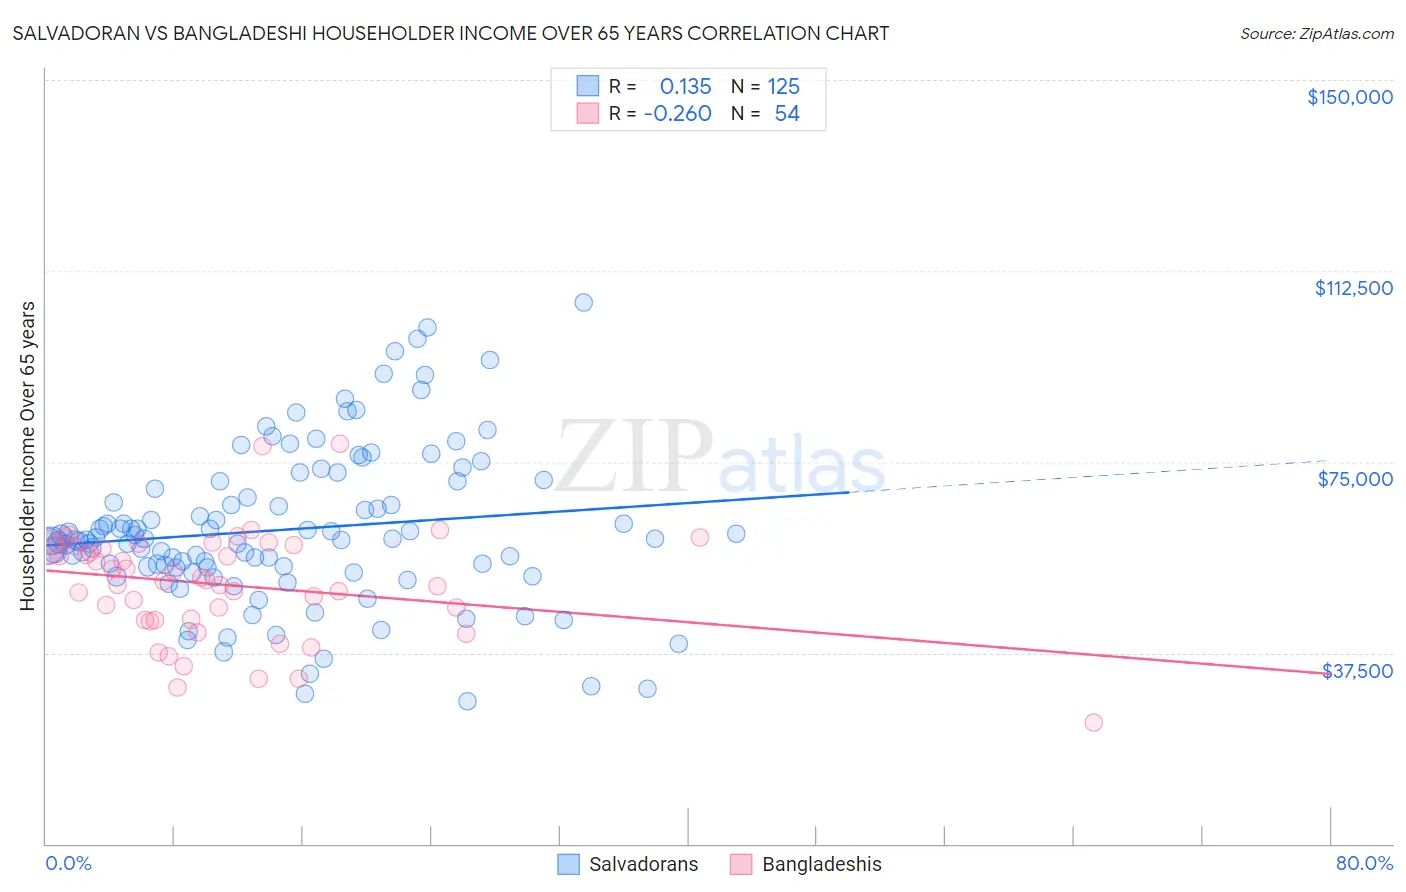
Salvadoran vs Bangladeshi Householder Income Over 65 years Correlation Chart
The statistical analysis conducted on geographies consisting of 397,216,988 people shows a poor positive correlation between the proportion of Salvadorans and household income with householder over the age of 65 in the United States with a correlation coefficient (R) of 0.135 and weighted average of $59,141. Similarly, the statistical analysis conducted on geographies consisting of 140,913,932 people shows a weak negative correlation between the proportion of Bangladeshis and household income with householder over the age of 65 in the United States with a correlation coefficient (R) of -0.260 and weighted average of $54,719, a difference of 8.1%.
Householder Income Over 65 years Correlation Summary
| Measurement | Salvadoran | Bangladeshi |
| Minimum | $28,014 | $23,750 |
| Maximum | $106,250 | $78,500 |
| Range | $78,236 | $54,750 |
| Mean | $61,666 | $50,859 |
| Median | $59,663 | $51,575 |
| Interquartile 25% (IQ1) | $54,245 | $43,904 |
| Interquartile 75% (IQ3) | $70,529 | $58,421 |
| Interquartile Range (IQR) | $16,284 | $14,517 |
| Standard Deviation (Sample) | $15,321 | $10,619 |
| Standard Deviation (Population) | $15,259 | $10,520 |
Similar Demographics by Householder Income Over 65 years
Demographics Similar to Salvadorans by Householder Income Over 65 years
In terms of householder income over 65 years, the demographic groups most similar to Salvadorans are Immigrants from South America ($59,151, a difference of 0.020%), Uruguayan ($59,090, a difference of 0.090%), Slovak ($59,039, a difference of 0.17%), Immigrants from Sudan ($59,248, a difference of 0.18%), and Nigerian ($58,992, a difference of 0.25%).
| Demographics | Rating | Rank | Householder Income Over 65 years |
| French | 20.2 /100 | #200 | Fair $59,656 |
| Dutch | 18.3 /100 | #201 | Poor $59,539 |
| Finns | 18.2 /100 | #202 | Poor $59,535 |
| Scotch-Irish | 16.9 /100 | #203 | Poor $59,447 |
| Arapaho | 16.0 /100 | #204 | Poor $59,383 |
| Immigrants | Sudan | 14.2 /100 | #205 | Poor $59,248 |
| Immigrants | South America | 13.0 /100 | #206 | Poor $59,151 |
| Salvadorans | 12.9 /100 | #207 | Poor $59,141 |
| Uruguayans | 12.3 /100 | #208 | Poor $59,090 |
| Slovaks | 11.7 /100 | #209 | Poor $59,039 |
| Nigerians | 11.2 /100 | #210 | Poor $58,992 |
| Immigrants | Nigeria | 10.7 /100 | #211 | Poor $58,942 |
| Colombians | 9.8 /100 | #212 | Tragic $58,851 |
| Whites/Caucasians | 9.8 /100 | #213 | Tragic $58,847 |
| Nepalese | 9.0 /100 | #214 | Tragic $58,761 |
Demographics Similar to Bangladeshis by Householder Income Over 65 years
In terms of householder income over 65 years, the demographic groups most similar to Bangladeshis are French American Indian ($54,699, a difference of 0.040%), Apache ($54,668, a difference of 0.090%), Belizean ($54,580, a difference of 0.25%), Jamaican ($54,560, a difference of 0.29%), and Guatemalan ($54,526, a difference of 0.35%).
| Demographics | Rating | Rank | Householder Income Over 65 years |
| Immigrants | Bangladesh | 0.3 /100 | #255 | Tragic $55,394 |
| German Russians | 0.3 /100 | #256 | Tragic $55,356 |
| Trinidadians and Tobagonians | 0.3 /100 | #257 | Tragic $55,327 |
| Ecuadorians | 0.2 /100 | #258 | Tragic $54,958 |
| West Indians | 0.2 /100 | #259 | Tragic $54,936 |
| Immigrants | West Indies | 0.2 /100 | #260 | Tragic $54,927 |
| Comanche | 0.2 /100 | #261 | Tragic $54,922 |
| Bangladeshis | 0.1 /100 | #262 | Tragic $54,719 |
| French American Indians | 0.1 /100 | #263 | Tragic $54,699 |
| Apache | 0.1 /100 | #264 | Tragic $54,668 |
| Belizeans | 0.1 /100 | #265 | Tragic $54,580 |
| Jamaicans | 0.1 /100 | #266 | Tragic $54,560 |
| Guatemalans | 0.1 /100 | #267 | Tragic $54,526 |
| Immigrants | Zaire | 0.1 /100 | #268 | Tragic $54,512 |
| Nicaraguans | 0.1 /100 | #269 | Tragic $54,474 |