Salvadoran vs Norwegian Wage/Income Gap
COMPARE
Salvadoran
Norwegian
Wage/Income Gap
Wage/Income Gap Comparison
Salvadorans
Norwegians
23.0%
WAGE/INCOME GAP
99.9/ 100
METRIC RATING
80th/ 347
METRIC RANK
29.0%
WAGE/INCOME GAP
0.1/ 100
METRIC RATING
323rd/ 347
METRIC RANK
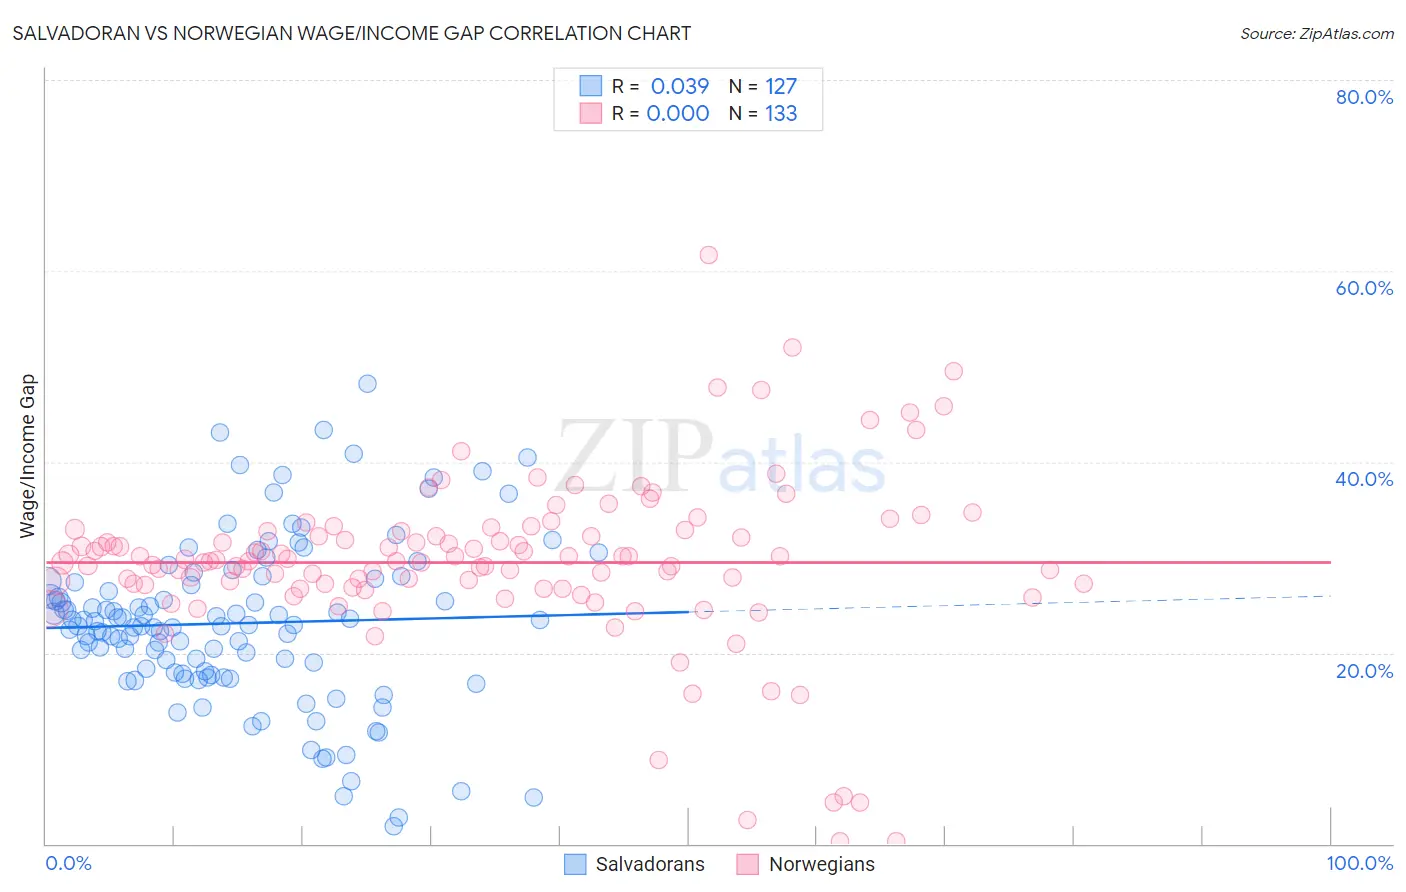
Salvadoran vs Norwegian Wage/Income Gap Correlation Chart
The statistical analysis conducted on geographies consisting of 398,802,169 people shows no correlation between the proportion of Salvadorans and wage/income gap percentage in the United States with a correlation coefficient (R) of 0.039 and weighted average of 23.0%. Similarly, the statistical analysis conducted on geographies consisting of 531,696,723 people shows no correlation between the proportion of Norwegians and wage/income gap percentage in the United States with a correlation coefficient (R) of 0.000 and weighted average of 29.0%, a difference of 25.9%.
Wage/Income Gap Correlation Summary
| Measurement | Salvadoran | Norwegian |
| Minimum | 1.8% | 0.24% |
| Maximum | 48.2% | 61.7% |
| Range | 46.5% | 61.5% |
| Mean | 23.1% | 29.5% |
| Median | 22.9% | 29.7% |
| Interquartile 25% (IQ1) | 18.0% | 27.0% |
| Interquartile 75% (IQ3) | 27.5% | 32.7% |
| Interquartile Range (IQR) | 9.5% | 5.7% |
| Standard Deviation (Sample) | 8.6% | 9.0% |
| Standard Deviation (Population) | 8.6% | 8.9% |
Similar Demographics by Wage/Income Gap
Demographics Similar to Salvadorans by Wage/Income Gap
In terms of wage/income gap, the demographic groups most similar to Salvadorans are Immigrants from Nicaragua (23.0%, a difference of 0.070%), Nigerian (23.0%, a difference of 0.15%), African (22.9%, a difference of 0.26%), Ecuadorian (22.9%, a difference of 0.39%), and Fijian (22.9%, a difference of 0.41%).
| Demographics | Rating | Rank | Wage/Income Gap |
| Immigrants | Eastern Africa | 99.9 /100 | #73 | Exceptional 22.8% |
| Immigrants | Burma/Myanmar | 99.9 /100 | #74 | Exceptional 22.8% |
| Fijians | 99.9 /100 | #75 | Exceptional 22.9% |
| Ecuadorians | 99.9 /100 | #76 | Exceptional 22.9% |
| Africans | 99.9 /100 | #77 | Exceptional 22.9% |
| Nigerians | 99.9 /100 | #78 | Exceptional 23.0% |
| Immigrants | Nicaragua | 99.9 /100 | #79 | Exceptional 23.0% |
| Salvadorans | 99.9 /100 | #80 | Exceptional 23.0% |
| Bermudans | 99.8 /100 | #81 | Exceptional 23.1% |
| Central Americans | 99.8 /100 | #82 | Exceptional 23.1% |
| Immigrants | Africa | 99.8 /100 | #83 | Exceptional 23.2% |
| Cubans | 99.7 /100 | #84 | Exceptional 23.3% |
| Immigrants | Cambodia | 99.7 /100 | #85 | Exceptional 23.3% |
| Cheyenne | 99.7 /100 | #86 | Exceptional 23.3% |
| Yuman | 99.7 /100 | #87 | Exceptional 23.3% |
Demographics Similar to Norwegians by Wage/Income Gap
In terms of wage/income gap, the demographic groups most similar to Norwegians are Immigrants from Singapore (28.9%, a difference of 0.11%), Croatian (29.0%, a difference of 0.12%), Welsh (28.9%, a difference of 0.13%), British (28.9%, a difference of 0.19%), and Slovak (28.9%, a difference of 0.25%).
| Demographics | Rating | Rank | Wage/Income Gap |
| Lithuanians | 0.1 /100 | #316 | Tragic 28.7% |
| Belgians | 0.1 /100 | #317 | Tragic 28.8% |
| Basques | 0.1 /100 | #318 | Tragic 28.8% |
| Slovaks | 0.1 /100 | #319 | Tragic 28.9% |
| British | 0.1 /100 | #320 | Tragic 28.9% |
| Welsh | 0.1 /100 | #321 | Tragic 28.9% |
| Immigrants | Singapore | 0.1 /100 | #322 | Tragic 28.9% |
| Norwegians | 0.1 /100 | #323 | Tragic 29.0% |
| Croatians | 0.0 /100 | #324 | Tragic 29.0% |
| Hungarians | 0.0 /100 | #325 | Tragic 29.0% |
| Immigrants | Belgium | 0.0 /100 | #326 | Tragic 29.0% |
| Immigrants | Iran | 0.0 /100 | #327 | Tragic 29.1% |
| Scandinavians | 0.0 /100 | #328 | Tragic 29.1% |
| Scottish | 0.0 /100 | #329 | Tragic 29.1% |
| Germans | 0.0 /100 | #330 | Tragic 29.2% |